
Cash flow is often called the lifeline of every business because it directly governs a company's ability to survive, grow, and thrive. Simply put, cash flow is the movement of money in and out of a business, how cash is generated, used, and managed day-to-day.
Without positive and well-managed cash flow, even profitable businesses can face insolvency, stall growth initiatives, or miss critical payments.
Accurate cash flow insights enable businesses to:
- Make informed decisions with clarity on available funds, avoiding surprises in payroll, vendor payments, or debt servicing
- Forecast financial health and anticipate liquidity needs, giving organizations the agility to plan investments or weather unexpected downturns
- Build investor confidence by demonstrating transparency and stewardship over working capital
- Drive sustainable growth through cash flow management that balances operational demands with strategic expansion
In a Nutshell
- Cash flow analysis tracks the inflows and outflows of cash to assess a business's financial health and liquidity.
- It helps businesses make informed decisions, forecast future financial needs, and drive sustainable growth.
- Key cash flow metrics, such as operating cash flow and free cash flow, provide insights into business efficiency and financial flexibility.
- Tools like INSIA simplify cash flow management with real-time data, predictive analytics, and AI-driven insights, empowering businesses to optimize their financial strategy.
What is Cash Flow Analysis?
Cash flow analysis is the process of tracking the inflows and outflows of cash within a business over a specific period to assess its liquidity and financial health. It involves examining cash generated from operations, investing, and financing activities, giving a comprehensive view of how effectively a company manages its cash resources.
This analysis is essential for businesses of all sizes as liquidity directly impacts the ability to meet obligations, fund growth, and survive economic fluctuations.
EisnerAmper’s 2025 insights emphasize that companies focusing on cash flow optimization and forecasting tend to improve their gross margins by 2-3% annually.
This improvement can translate into millions in additional free cash available for growth, debt reduction, or dividends, thus strengthening overall business sustainability.
Its significance in business operations:
- It reveals whether a company has enough cash to pay bills, salaries, and debts on time.
- It aids in making informed strategic decisions, such as investing in new projects or securing additional financing.
- It highlights the company’s ability to withstand economic fluctuations and maintain smooth operations.
Essential Cash Flow Metrics Every Business Should Track
This table summarizes the key cash flow metrics every business should monitor to maintain healthy liquidity and operational efficiency.
Each metric provides insights into different aspects of cash management, from core operations to investment and financing activities.
| Metric | Definition | Significance | Formula / Notes |
|---|---|---|---|
| Operating Cash Flow (OCF) | Cash generated from core business operations (sales, expenses, working capital changes). | Indicates if the business can sustain operations without external financing. | Calculated via direct or indirect method from cash flow statement |
| Free Cash Flow (FCF) | Cash remaining after capital expenditures needed to maintain or expand assets. | Shows available cash for growth, debt repayment, or dividends; a measure of financial flexibility. | FCF = Operating Cash Flow – Capital Expenditures |
| Cash Conversion Cycle (CCC) | Time taken to convert inventory and other inputs into cash from sales. | Measures efficiency in managing working capital; shorter cycle means faster cash recovery. | CCC = Days Inventory Outstanding + Days Sales Outstanding – Days Payables Outstanding |
| Operating Cash Flow Margin | Operating cash flow expressed as a percentage of total revenue. | Reflects operational profitability in cash terms; higher margin means stronger cash generation. | OCF Margin = (Operating Cash Flow ÷ Revenue) × 100 |
| Operations/Net Sales Ratio | Ratio comparing operating cash flow to net sales. | Indicates efficiency of converting sales into cash. | Operating Cash Flow ÷ Net Sales |
| Net Cash Flow | The net change in cash position over the period, combining all inflows and outflows. | Shows overall cash increase or decrease, essential for understanding liquidity changes. | Sum of Operating + Investing + Financing Cash Flows |
Also Read: Strategies to Improve Work, Operational, and Production Efficiency
To gain meaningful insights from cash flow analysis, businesses must follow a structured approach. This comes from performing cash flow analysis. Let’s see how!
How To Perform Cash Flow Analysis?
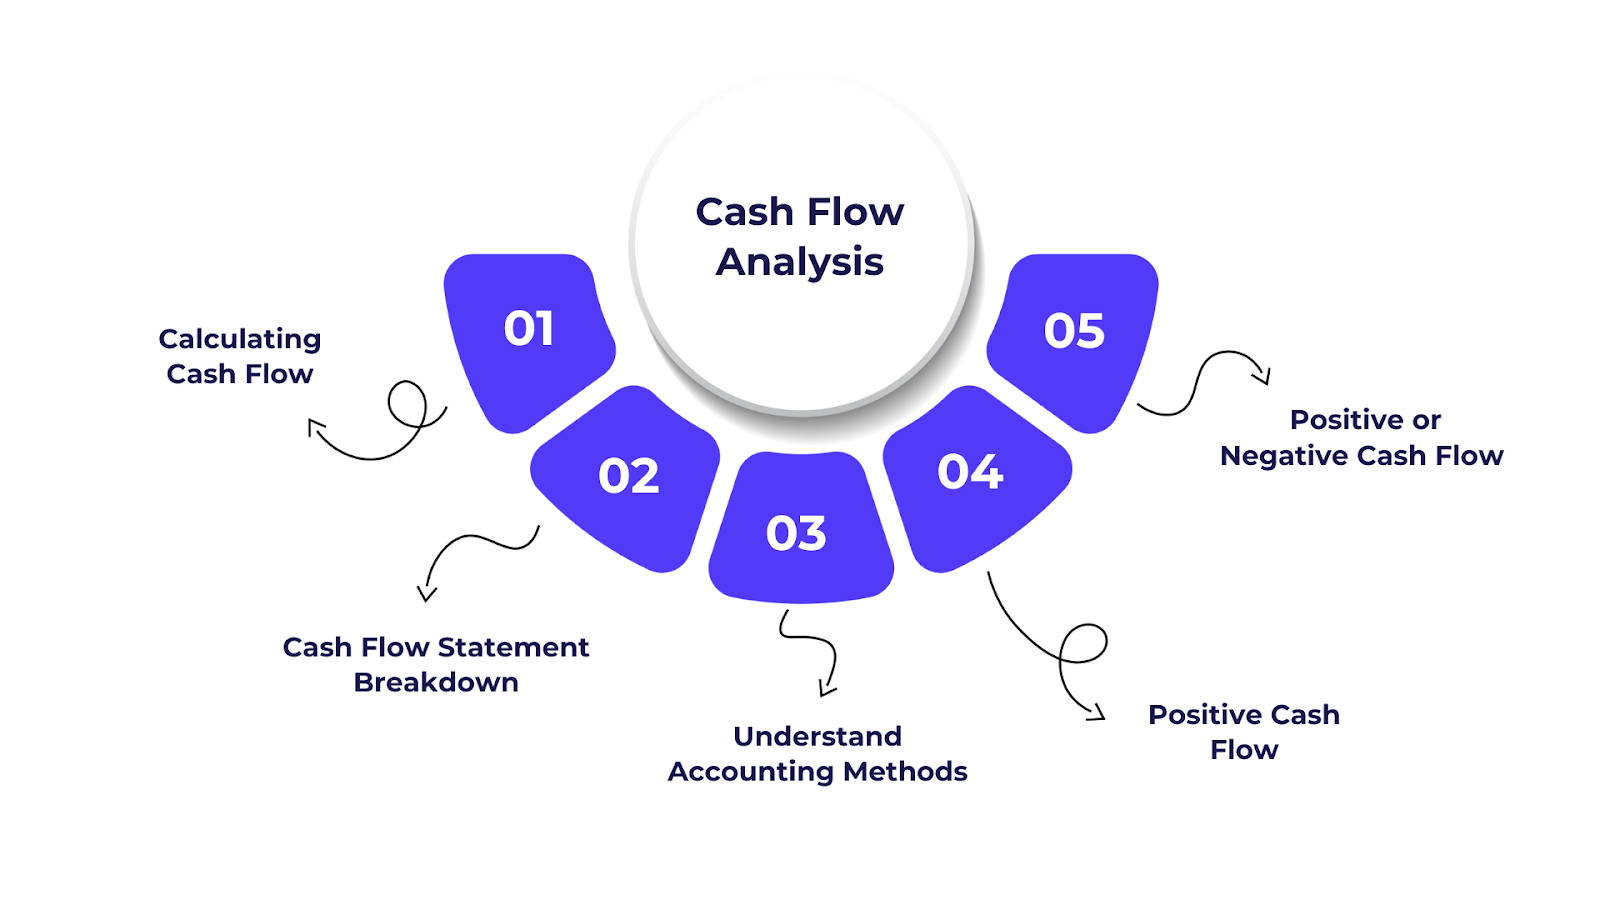
Performing cash flow analysis helps businesses assess their financial health by tracking cash inflows and outflows from operating, investing, and financing activities.
It enables informed decision-making, identifies potential risks or opportunities, and ensures sustainable growth by optimizing cash management and forecasting future needs.
Step 1: Calculating Cash Flow: Direct vs. Indirect Methods
Direct Method: In the direct method, cash flow is calculated by directly adjusting cash inflows and outflows, providing a clear view of cash transactions. It focuses on actual receipts and payments.
Calculation:
Cash Flow from Operating Activities = Cash Receipts from Customers - Cash Payments
Example: If a company receives $200,000 in cash from customers and pays $150,000 for operating expenses, the cash flow is $50,000.
Indirect Method: The indirect method starts with net income and adjusts for non-cash items like depreciation, changes in working capital, and other accruals to calculate cash flow. It’s more commonly used, especially for larger businesses.
Calculation:
Cash Flow from Operating Activities = Net Income + Non-Cash Expenses + Changes in Working Capital
Example: Starting with net income, adjustments are made for depreciation, changes in inventory, and accounts receivable to arrive at cash flow.
Step 2: The Cash Flow Statement Breakdown
A company’s statement of cash flows is the central tool for cash flow analysis, categorizing all cash activities into three main components:
1. Operating Activities
Operating activities refer to the primary revenue-generating activities of the business. Cash flow from operating activities includes:
- Sales Revenue: Cash received from customers for products or services sold.
- Operating Expenses: Cash paid for the day-to-day running of the business, such as rent, salaries, and utilities.
For example, if a company sells goods worth $50,000 but the cash outflow for operational costs (e.g., wages, rent) is $30,000, the net cash from operating activities would be $20,000.
2. Investing Activities
Investing activities involve cash transactions related to the acquisition or disposal of long-term assets. This includes:
- Purchasing Assets: Outflows related to buying property, equipment, or other capital investments.
- Investment Income: Inflows from the sale of assets or the return on investments (e.g., dividends from stocks or sales of real estate).
For instance, if a business buys a new piece of machinery for $10,000, this is recorded as an outflow in the investing activities section. Conversely, if the company sells an old vehicle for $5,000, it would be recorded as an inflow.
3. Financing Activities
Financing activities represent how a company funds its operations through external sources. It includes:
- Debt Issuance/Repayment: Cash inflows from borrowing or outflows for repaying loans or interest.
- Issuing Shares: Cash inflows from issuing new stock to investors.
- Dividend Payments: Cash outflows paid to shareholders as dividends.
For example, if a company takes out a loan of $50,000, it would report an inflow under financing activities. If it repays $20,000 of that loan, the repayment would be a cash outflow.
Step 3: Understand Accounting Methods
Understanding the difference between accounting methods is essential to interpreting cash flow data accurately:
1. Accrual Accounting
Accrual accounting records revenues and expenses when they are earned or incurred, regardless of when cash transactions occur. This method provides a more accurate picture of a company’s financial health over time, as it includes all obligations and earned revenues.
2. Cash Accounting
Cash accounting records revenues and expenses only when cash is actually received or paid. This method gives a more immediate view of a company’s cash position but may not fully reflect the long-term financial status.
This table provides a clear distinction between the two accounting methods:
| Aspect | Accrual Accounting | Cash Accounting |
|---|---|---|
| Revenue Recognition | When earned (e.g., when services are delivered). | When cash is received (e.g., when payment is made). |
| Expense Recognition | When incurred (e.g., when goods are received). | When cash is paid (e.g., when bills are paid). |
| Focus | Provides a more accurate view of financial health over time. | Gives a clear view of cash flow at a specific moment. |
| Complexity | More complex, requires tracking of receivables and payables. | Simpler, easier to manage for small businesses. |
| Financial Picture | Includes future obligations and earned income. | Only shows cash inflows and outflows. |
| Common Use | Preferred by larger businesses or those with inventory. | Often used by smaller businesses or sole proprietors. |
Step 4: Understanding Positive Cash Flow & Negative Cash Flow
Positive Cash Flow occurs when a business’s incoming cash exceeds its outgoing cash during a specific period. This is generally a sign of financial health, as the business can meet its obligations, reinvest, and grow.
- Significance: Positive cash flow allows businesses to pay off debts, expand operations, and fund new opportunities without relying on outside financing. It supports sustainable growth and attracts investors.
- Example: A company with consistent positive cash flow can confidently pursue acquisitions, invest in marketing, or upgrade equipment.
Negative Cash Flow happens when a business’s outgoing cash exceeds incoming cash. While not necessarily a sign of financial failure, prolonged negative cash flow can indicate liquidity issues and may result in operational disruptions or difficulty securing financing.
- Significance: Negative cash flow requires businesses to either secure additional financing or cut costs. If left unaddressed, it can lead to insolvency.
- Example: A retail business experiencing negative cash flow due to slow sales might need to reduce inventory or negotiate better payment terms with suppliers to manage its cash position.
Step 5: Drawing Conclusions from Positive or Negative Cash Flow
This step involves interpreting the financial results to determine the necessary actions, whether it's expanding, restructuring, or optimizing operations.
The conclusions drawn here directly influence the company’s approach to growth, cost management, and financial planning.
| Cash Flow Type | Conclusion | Action/Decision |
|---|---|---|
| Positive Cash Flow | The business is generating more cash than it is spending. |
|
| Negative Cash Flow | The business is spending more cash than it is generating. |
|
| Short-Term Negative Cash Flow | Could be a temporary situation due to seasonal fluctuations or large investments. |
|
| Long-Term Negative Cash Flow | Indicates systemic problems that need attention. |
|
Once you've performed cash flow analysis and gained insights into your business's cash movement, the next step is to understand the key cash flow ratios and indicators.
Key Cash Flow Ratios and Indicators
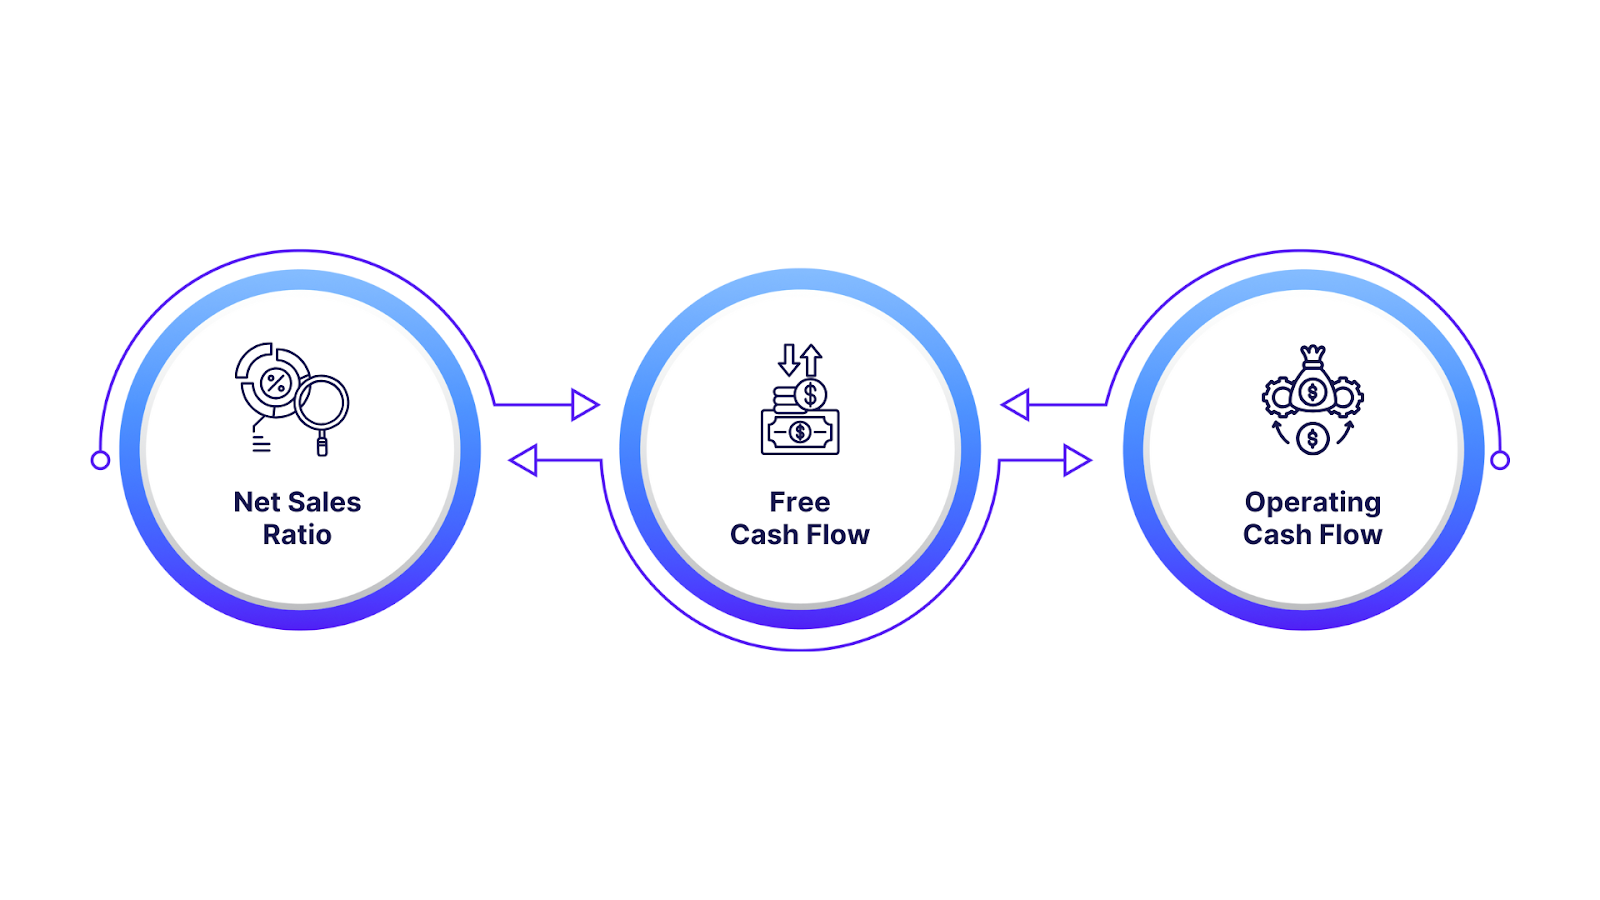
Tracking key cash flow ratios and indicators is essential for assessing the efficiency and financial health of a business. These metrics provide insights into how well a company generates cash from its operations, manages expenses, and handles its investments.
1. Operations/Net Sales Ratio
This ratio measures how efficiently a company is converting its sales into operational cash. It compares cash generated by operating activities to total sales.
Formula:
Operations/Net Sales Ratio = Cash Flow from Operations
/ Net Sales
Significance: A higher ratio indicates that the company is efficiently converting sales into cash, which is important for meeting operational expenses and reinvesting in the business. A low ratio may signal inefficiencies in converting sales into cash, which can hinder the company’s ability to fund growth.
Example: A ratio of 0.5 means that for every dollar of sales, the company is generating 50 cents in operational cash flow. This suggests solid operational efficiency, making it easier for the company to reinvest and sustain operations.
2. Free Cash Flow (FCF)
Free cash flow is the cash remaining after a business has paid for its capital expenditures. It’s a key indicator of a company’s ability to generate enough cash to maintain and grow operations without relying on external financing.
Formula:
Free Cash Flow (FCF)=Operating Cash Flow−Capital Expenditures
Significance: Free cash flow is critical for funding growth opportunities, such as new investments or acquisitions, without depending on loans. It also enables businesses to pay dividends to shareholders or repurchase shares. A consistent positive FCF suggests strong financial health and flexibility for strategic moves.
Example: A company with high free cash flow can reinvest in new technology or infrastructure to expand its operations, or use it for debt reduction or shareholder dividends.
3. Operating Cash Flow Margin
The operating cash flow margin measures the percentage of revenue that translates into cash from operating activities. It is an essential indicator of how well a company is managing its operations to generate cash.
Formula:
Operating Cash Flow Margin= Operating Cash Flow/Net Sales ×100
Significance: A higher margin suggests that a business is generating cash efficiently from its core operations, which is a positive indicator of operational health. A low margin may indicate that a company’s sales are not translating into sufficient cash, which could impact liquidity and growth.
Example: A company with a 20% operating cash flow margin means that 20% of its sales are converted into cash, which can be used for reinvestment or debt repayment. A higher margin implies better operational efficiency.
Also Read: Advanced Analytics in Asset Performance Management
It's important to recognize that even with effective analysis, businesses often face common challenges in managing their cash flow.
Common Challenges in Cash Flow Management
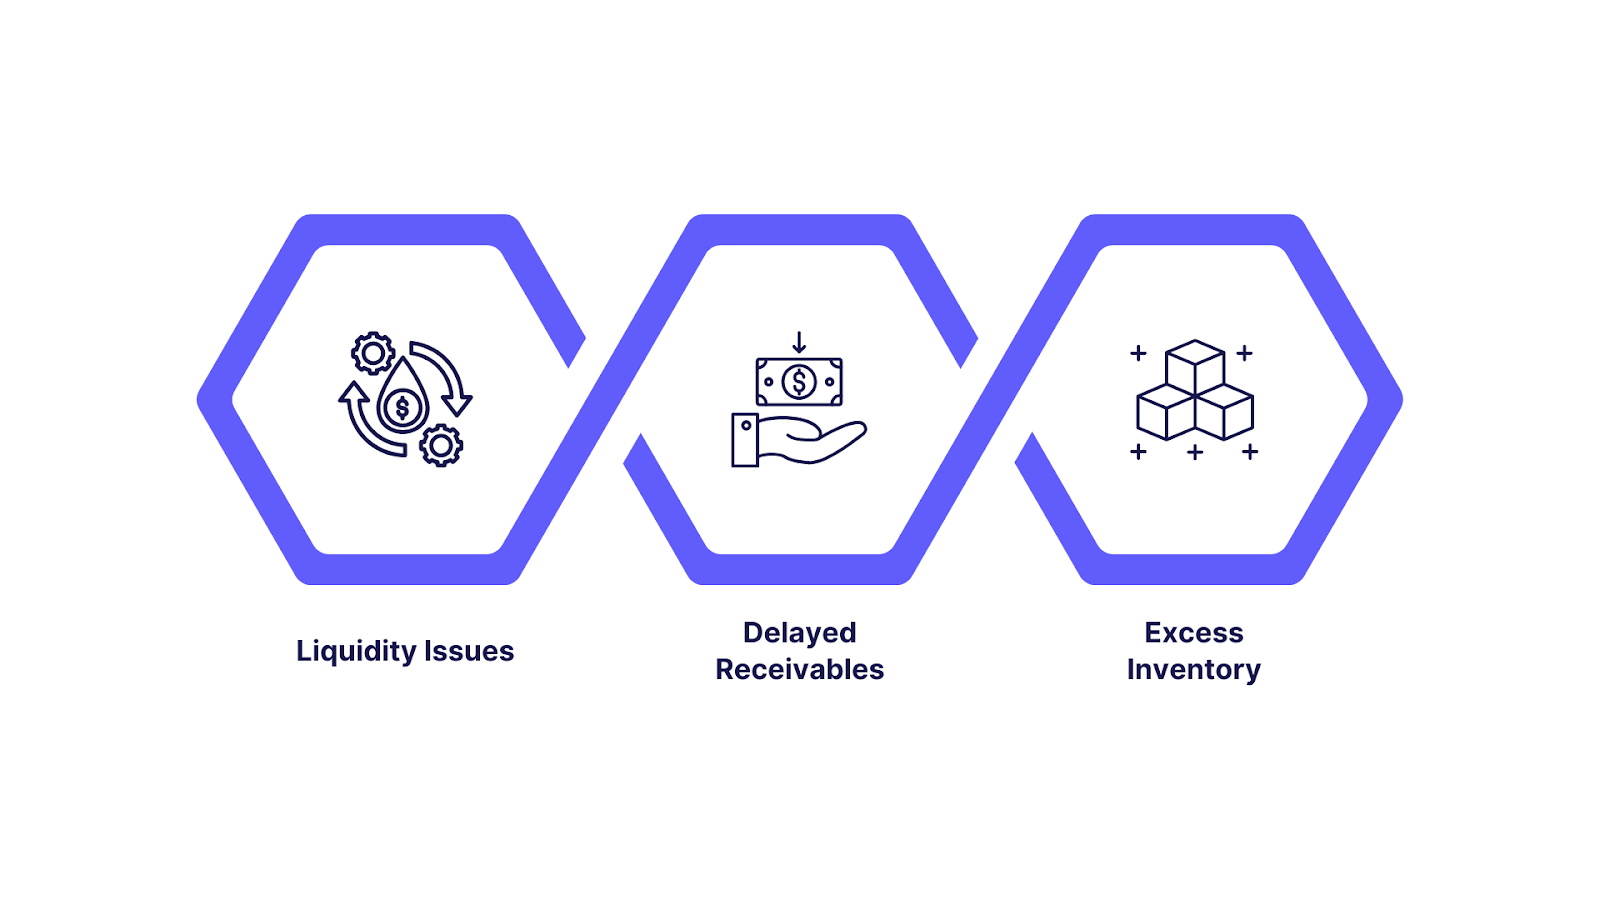
Managing cash flow effectively is essential, yet businesses often face challenges like liquidity issues, delayed receivables, and excess inventory, all of which can strain resources. Identifying and addressing these challenges is key to maintaining healthy cash flow and ensuring operational efficiency.
1. Liquidity Issues
This occurs when a business has insufficient cash to cover its short-term obligations, such as payroll, bills, and supplier payments. It can arise due to inconsistent cash inflows, unexpected expenses, or poor cash management.
2. Delayed Receivables:
When customers delay their payments beyond the agreed terms, businesses experience a delay in cash inflows. This can lead to cash shortages, even if the business is technically profitable.
3. Excess Inventory:
Overstocking inventory ties up cash that could be used elsewhere in the business. Excess inventory often results from overestimating demand or inefficient inventory management, causing cash to be tied up in unsold goods.
Tips to improve these areas:
- Implement strict credit control policies to reduce late payments, including clear payment terms and proactive follow-ups.
- Use technology to automate invoicing and reminders.
- Optimize inventory levels with data-driven demand forecasting to avoid excess stock while meeting customer needs.
- Negotiate better payment terms with suppliers to improve cash conversion cycles.
How INSIA.ai Makes Cash Flow Analysis Easier
INSIA.ai provides several features and capabilities that can significantly enhance and streamline cash flow analysis for businesses. Here’s how it can be leveraged for effective cash flow management:
Instantly See Key Cash Flow Metrics
- Access built-in templates for common cash flow metrics, like free cash flow and operating cash flow.
- Compare projected vs. actual cash movement with no manual calculations needed.
Analyze Without Coding
- Simply type in your question or search for a cash metric: INSIA.ai instantly shows trends, tables, or charts.
- Build custom dashboards and reports with a few clicks, no formulas or scripting required.
Real-Time Data & Alerts
- Connect your databases, spreadsheets, or finance systems to view the latest cash flow data in one place.
- Live dashboards and automatic alerts let you spot unusual cash spikes, dips, or late payments as soon as they happen.
Easy Forecasting & Scenario Planning
- The platform uses AI to project future cash flows, recognizing seasonal patterns and recurring expenses.
- Run “What if?” scenarios, such as predicting impacts of delayed payments, to test your business’s resilience.
Data Cleansing and Seamless Transformation
- INSIA.ai automatically cleans and standardizes incoming data, saving hours of manual work.
- Quickly organize cash flow details by timeline, client, or business unit for more precise insights.
AI-Driven Insights
- Get automatic notifications about potential issues or outliers, no need to go searching yourself.
Visual, Shareable Results
- Over 40 easy-to-understand visualization options for sharing your cash flow reports with stakeholders or board members.
INSIA helps you move from slow, manual spreadsheets to a fast and clear, AI-powered way of understanding your company’s cash flow. This means fewer errors, better forecasts, and quicker decisions.
Conclusion
Cash flow is the fundamental driver of business sustainability and long-term viability. Tailoring cash flow analysis and management to the specific size and lifecycle stage of a business ensures relevant insights and realistic strategies.
For instance, startups might prioritize liquidity and runway, while mature companies focus on optimizing free cash flow and funding expansion. Positive cash flow acts as the engine that fuels ongoing operations, strategic investments, and resilience against economic uncertainties. Ultimately, it enables businesses not only to survive but to thrive and scale with confidence.
INSIA makes it effortless to monitor real-time cash movements, forecast future scenarios, and receive actionable insights, all without requiring deep technical expertise.
This empowers businesses of any size to master their cash flow dynamics proactively, reduce risks, and make data-driven decisions that align with their unique growth journey.