
A financial dashboard serves as a business intelligence platform that provides finance teams and decision-makers with instant, intuitive insights into the organization’s financial health. This enables faster and more informed decisions.
The global real-time dashboard market was valued at approximately $12 billion in 2023 and is projected to grow to $32 billion by 2032, at a compound annual growth rate (CAGR) of 11.5%. This surge is driven by rising demand for data-driven decision-making and the need for instantaneous access to financial and operational metrics.
The guide is designed specifically for finance professionals, CFOs, business owners, and financial analysts. It supports those who seek to use technology for clearer financial insights, improved reporting accuracy, and faster decision-making.
At a Glance
- Learn how dashboard financial tools deliver real-time insights through clear visualizations of key metrics.
- Explore examples of CFO, cash flow, revenue, and other dashboards tailored to specific finance roles.
- Understand which KPIs to track across profitability, liquidity, efficiency, and growth.
- See how INSIA’s AI-powered platform simplifies dashboard creation and improves decision-making.
What Is a Financial Dashboard?
A financial dashboard is a digital interface that visually consolidates and displays key financial metrics and performance indicators in real time.
Its core function is to provide finance teams and decision-makers with an intuitive and centralized view of an organization’s financial health, enabling continuous monitoring and quick assessment of essential financial data such as revenue, expenses, cash flow, profitability, and budget adherence.
By transforming complex financial data into easy-to-understand visualizations like charts, graphs, and gauges, financial dashboards empower users to track performance efficiently and make timely, informed decisions.
Key Benefits of Financial Dashboards
- Visibility: Offers a comprehensive, real-time snapshot of an organization’s financial status, making critical data accessible at a glance and improving transparency across departments.
- Speed: Accelerates decision-making by providing instant access to up-to-date financial figures and trends, reducing the time spent on manual data gathering and analysis.
- Alignment: Facilitates alignment of teams by providing a shared understanding of financial goals and performance metrics, encouraging collaborative efforts toward achieving business objectives.
Also Read: Top SDR Dashboard Examples to Boost Sales
Common Types of Financial Dashboards
Before diving into the unique types of financial dashboards, picture a toolkit built for financial clarity: each dashboard is designed with a distinct business need in mind.
Whether you oversee budgets or track fundraising, there’s a dashboard fashioned to bring strategic focus and speed to your financial operations.
Let’s explore how each type can empower different roles, unlock deeper insights, and foster informed decisions.
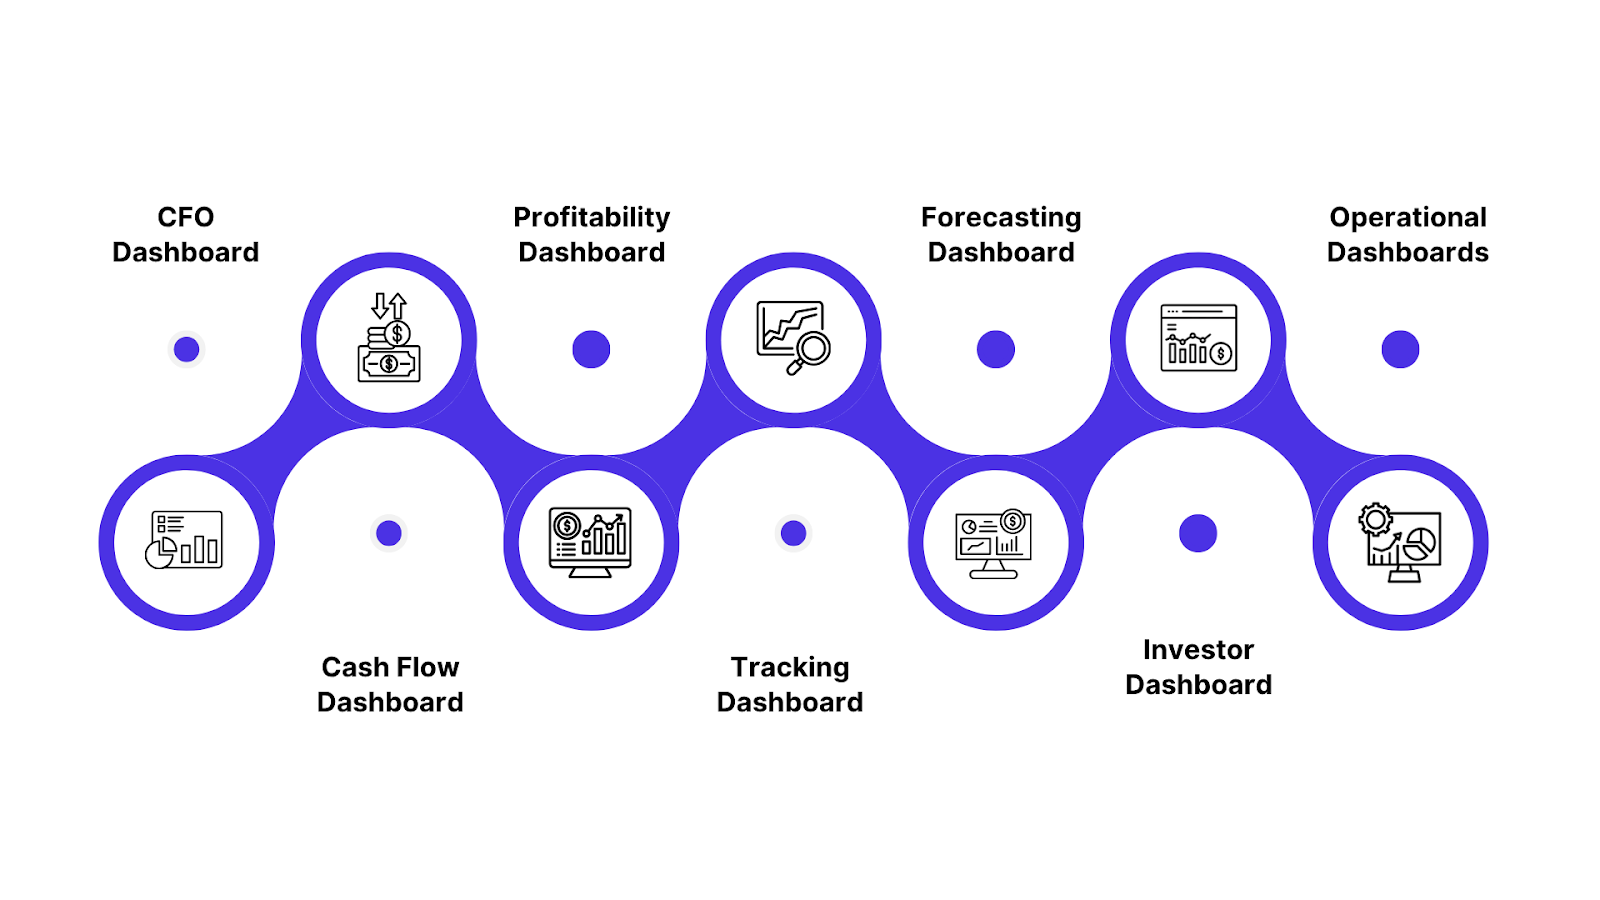
1. CFO Dashboard
A CFO dashboard offers a high-level financial overview tailored for senior leaders. It aggregates essential indicators, like profitability, cash runway, and budget variance into one digestible interface. For busy executives, it’s a real-time command center spotlighting trends and exceptions.
Insight: This dashboard promotes rapid scenario analysis, enabling leaders to allocate capital, adjust strategy, and forecast risk with confidence.
2. Cash Flow Dashboard
The cash flow dashboard steers liquidity management by tracking the pulse of inflows, outflows, burning rate, and short-term projections. It’s an essential alert system for ensuring there’s always enough cash on hand to meet obligations.
Insight: Early detection of shortfalls or surpluses empowers teams to optimize working capital and negotiate from a position of strength during tough market cycles.
3. Revenue & Profitability Dashboard
Revenue and profitability dashboards dissect sales trends, margin dynamics, and recurring revenue streams. They clarify which products, services, or segments are propelling growth or weighing down earnings.
Insight: With granular breakdowns, leadership can swiftly pivot sales strategies, eliminate underperformers, or double down on high-margin opportunities, all while tracking performance against revenue forecasts.
4. Expense Tracking Dashboard
An expense dashboard puts spending under the microscope, revealing details down to department, project, or line item. Teams can compare real versus planned expenditures and instantly spot overruns.
Insight: Transparency here fuels accountability and helps organizations contain costs by highlighting patterns, inefficiencies, and opportunities for negotiation.
5. Budgeting & Forecasting Dashboard
This dashboard aligns forecasts and actuals, spotlighting where performance matches or strays from the plan. It’s foundational for effective planning cycles and iterative financial forecasting.
Insight: Dynamic dashboards enable real-time scenario testing, so finance teams can course-correct swiftly in response to emerging trends, keeping goals realistic and achievable.
6. Fundraising/Investor Dashboard
For startups and nonprofits, this dashboard focuses on fundraising targets, investor engagement, and sustainability metrics (e.g., burn rate, runway). It’s a tool for both internal tracking and external reporting to stakeholders.
Insight: Regularly updated visual milestones help maintain accountability and demonstrate traction, building trust with current and potential investors.
7. Departmental/Operational Dashboards
These role-based dashboards drill into metrics tailored for front-line teams, sales may track pipeline velocity, while marketing reviews lead conversion costs. Operations can monitor efficiency and margin impact.
Insight: Department-specific dashboards democratize financial data, equipping more staff to align efforts with overall business objectives and respond in real time to shifting priorities.
A Quick Comparison Table:
Below is a comparison table outlining each main financial dashboard type, with a brief description, their typical use cases, and the key audience that benefits most from each.
| Dashboard Type | Brief Description | Typical Use Case | Key Audience |
|---|---|---|---|
| CFO Dashboard | High-level, real-time overview of financial performance and KPIs for strategic decision-making. | Executive snapshot for fast board reporting & scenario analysis | CFOs, Finance VPs, C-Suite Executives |
| Cash Flow Dashboard | Monitors cash inflows, outflows, and liquidity status, often with short-term predictions. | Daily or weekly liquidity planning, ensuring bills are covered | Controllers, Treasurers, CFOs |
| Revenue & Profitability | Tracks sales, revenue streams, gross/net margins, and trends. | Sales performance review, revenue forecasting | Sales Leaders, CFOs, Finance Teams |
| Expense Tracking Dashboard | Breaks down spending by department, project, or category, comparing actual vs. planned expenses. | Identifying cost overruns, improving spending control | Department Heads, Accountants |
| Budgeting & Forecasting | Compares budgeted amounts to actuals, and enables rolling forecasts and scenario planning. | Quarterly budget reviews, financial planning cycles | FP&A Teams, Financial Planners |
| Fundraising/Investor | Monitors fundraising progress, runway, engagement, and metrics key to investors or donors. | Investor reporting, board decks for startups/NGOs | Founders, Development/Investor Teams |
| Departmental/Operational | Role- or department-specific dashboard for granular financial and operational KPIs. | Operational oversight, aligning teams with goals | Team Leaders, Department Managers |
Also Read: Advanced Analytics in Asset Performance Management
With a clear understanding of the different types of financial dashboards and how each serves a unique audience within the organization, the next step is to examine what brings these dashboards to life. That begins with the metrics and key performance indicators (KPIs) they monitor.
Key Metrics and KPIs for Financial Dashboards
To transform dashboards from simple data displays to insightful decision-making tools, the selection of key performance indicators (KPIs) is critical.
Organizing KPIs into meaningful categories related to different aspects of financial health clarifies their purpose and highlights their role in comprehensive financial analysis.
Quick Overview Table:
| Category | Key Metrics / KPIs | Purpose / What They Show |
|---|---|---|
| Profitability KPIs | Gross Margin, Net Profit Margin, Operating Margin | Measure the company’s ability to generate profit from revenue, indicating operational success and earnings sustainability. |
| Liquidity KPIs | Current Ratio, Quick Ratio, Cash Ratio | Reveal whether the company has enough liquid assets to cover short-term liabilities, highlighting cash flow and solvency health. |
| Efficiency KPIs | Days Sales Outstanding (DSO), Inventory Turnover, Accounts Receivable Turnover | Evaluate how effectively the company manages assets and collects payments, reflecting operational efficiency and working capital management. |
| Growth KPIs | Revenue Growth Rate, EBITDA, Return on Investment (ROI) | Track the company’s capacity to grow revenue and profits, and measure the success of investments, signaling long-term viability. |
Profitability KPIs
These KPIs are the heart of understanding financial success. Gross Margin shows the leftover revenue after accounting for the direct cost of goods sold, indicating how efficiently the company produces or delivers its products.
Net Profit Margin goes a step further by including all expenses, taxes, and costs, representing what ultimately remains as profit.
Operating Margin isolates earnings from core operations, stripping out one-off or financing effects to provide clearer operational efficiency insights.
Liquidity KPIs
Short-term financial health depends on liquidity. Metrics like the Current Ratio compare current assets against short-term obligations, signaling the ability to pay bills on time.
The Quick Ratio refines this by excluding inventory, focusing only on the most liquid assets.
The Cash Ratio is the strictest measure, comparing cash and cash equivalents directly to liabilities. These KPIs help anticipate cash shortages or surpluses vital for making informed financing or operational decisions.
Efficiency KPIs
These indicators monitor how well a company manages its resources. Days Sales Outstanding (DSO) measures the average time to collect payment after a sale, where lower DSO means faster cash inflows.
Inventory Turnover tracks how often inventory is sold and replenished over a period, reflecting supply chain and demand alignment.
Accounts Receivable Turnover assesses the effectiveness of credit policies and collection efforts. Together, these KPIs uncover bottlenecks and opportunities for improving working capital.
Growth KPIs
Sustained success demands growth, which these KPIs illuminate. Revenue Growth Rate offers a straightforward measure of sales expansion over time, signaling market acceptance and business momentum.
EBITDA (earnings before interest, taxes, depreciation, and amortization) provides insight into operational profitability excluding accounting and financing nuances.
Return on Investment (ROI) presents how well invested capital is generating returns, crucial for assessing strategic projects, capital expenditures, or acquisitions.
Financial Health Check Questions
Basic key questions for each KPI group that explain what each metric shows about the company’s financial health.
- Are we profitable and sustainable? (Profitability KPIs)
- Can we meet our short-term liabilities reliably? (Liquidity KPIs)
- How efficiently are we managing assets and receivables? (Efficiency KPIs)
- Are we growing our revenues and investing wisely? (Growth KPIs)
Also Read: What is Sales Analytics? Key Metrics Explained
Having established the critical financial metrics that form the backbone of effective dashboards, it's equally important to understand their core features and capabilities. These features empower dashboards to deliver real-time insights, interactive analysis, and actionable intelligence.
Essential Features that Power Financial Dashboards
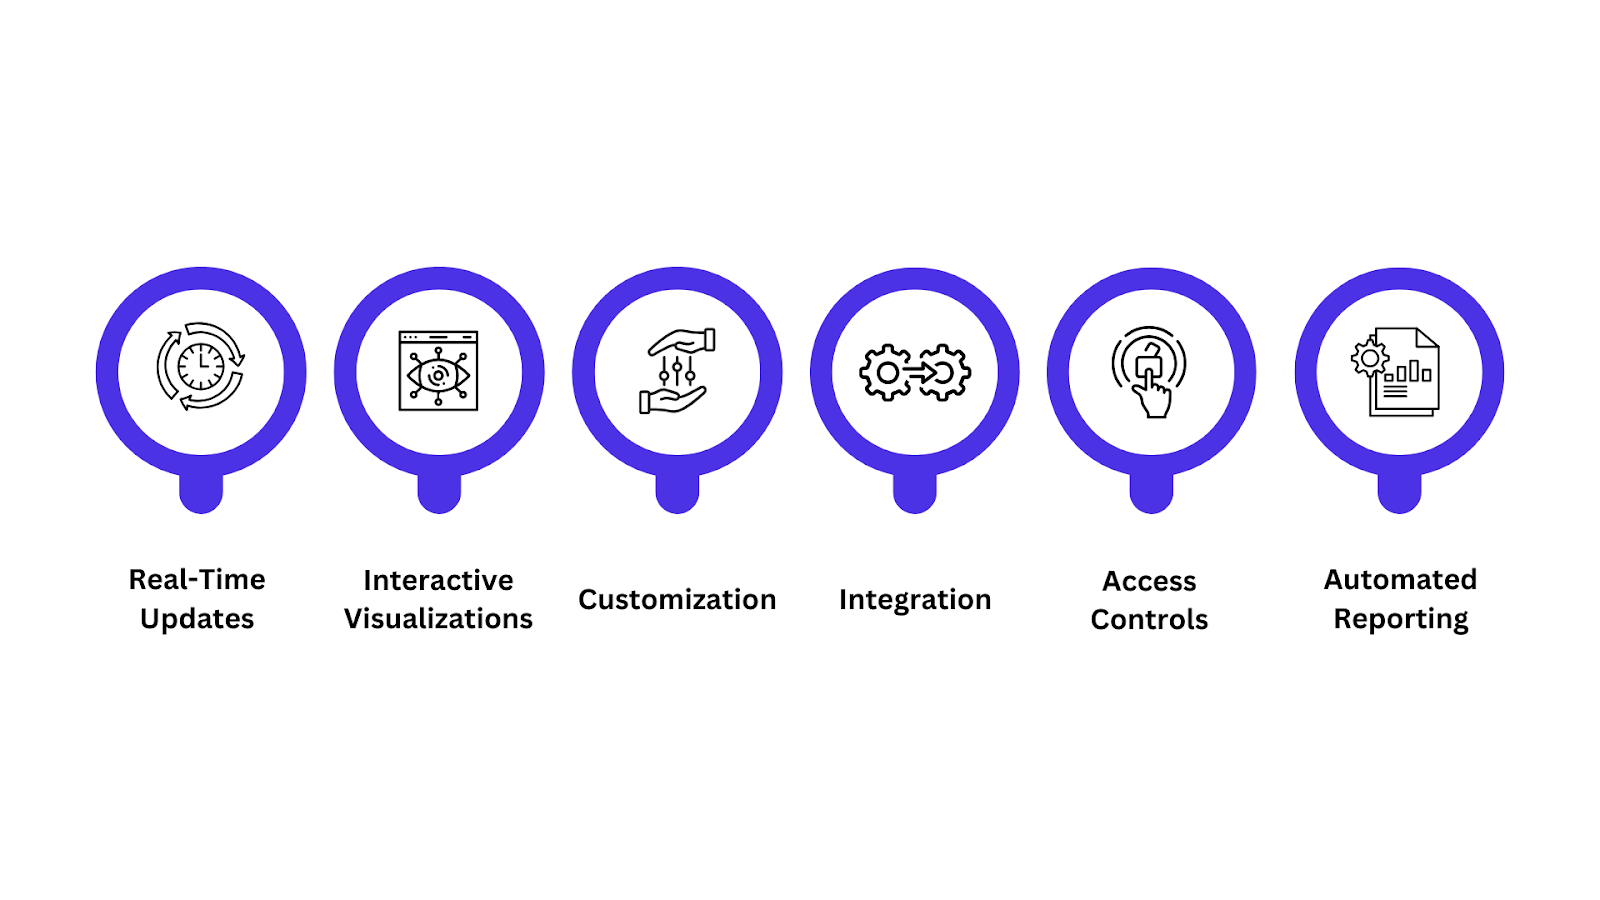
The right features empower teams to move quickly from data to decision, ensuring everyone, from finance to leadership stays aligned, nimble, and in control.
1. Real-Time Updates & Automation
- Continuously refresh data from ERP, CRM, and cloud systems automatically.
- Enables instant visibility into financial health with minimal manual effort.
- Reduces errors and saves time by syncing data regularly without user input.
2. Interactive Visualizations & Drill-Downs
- Users can click and filter charts to explore details behind summaries.
- Drill into transactional or dimensional data (time, geography, units).
- Helps discover trends and root causes without leaving the dashboard.
3. Customization
- Tailor dashboards with filters, segments, and timeframe comparisons.
- Focus on departments, products, or specific business needs.
- Adjust visual styles to highlight priority KPIs and reporting preferences.
4. Integration
- Connects with ERP, CRM, Excel, and APIs for unified data access.
- Breaks down data silos by centralizing information from multiple sources.
- Supports comprehensive, cross-functional financial analysis.
5. Access Controls & User Roles
- Role-based permissions safeguard sensitive financial data.
- Provides appropriate data views for executives versus operational staff.
- Ensures compliance with security and governance standards.
6. Automated Reporting
- Schedules and delivers reports automatically via email or messaging.
- Keeps teams aligned with consistent updates without manual intervention.
- Customizable timing and content based on roles or triggers.
Each feature transforms static financial data into a dynamic, reliable, and user-friendly decision-making tool, helping organizations stay proactive and informed.
Next, let’s walk through a practical, step-by-step guide for building a financial dashboard, from defining your goals and gathering data, to designing visuals and enabling automation.
How to Build a Financial Dashboard (Step-by-Step Guide)
Creating a financial dashboard is about designing a tool that drives clarity, action, and results.
By following a proven, step-by-step process, you ensure your dashboard delivers the right insights to the right people, empowering smarter financial decisions and real-time visibility across your organization.
Step 1: Define Objectives and Target Users
Clarify what you want your dashboard to achieve. Are you tracking profitability, cash flow, expense control, or growth? Identify the key questions the dashboard should answer and who will use it: CFOs, finance teams, or department managers. This focus ensures relevance and usability.
Step 2: Select the Right Metrics and KPIs
Choose financial metrics that align with your objectives. For example, profitability goals might call for Gross Margin and Net Profit Margin, while liquidity tracking would emphasize Current Ratio and Cash Flow. Limit yourself to key high-impact KPIs to avoid clutter and maintain clarity.
Step 3: Gather and Prepare Data
Collect data from all relevant sources, ERP systems, accounting software, CRM platforms, spreadsheets, etc. Ensure the data is accurate, complete, and consistent. Cleanse and organize it logically to facilitate integration and analysis.
Step 4: Choose Tools and Software
Select a tool that matches your technical skills and business needs. Options include Excel and Google Sheets for basic dashboards or advanced platforms like Power BI, Tableau, and Qlik for more interactive, real-time visuals and data exploration.
Step 5: Design for Clarity and Usability
Create a clean layout emphasizing visual hierarchy, place the most important KPIs prominently at the top. Use appropriate chart types (e.g., line charts for trends, bar charts for comparisons). Choose color schemes wisely to highlight key data without overwhelming users.
Step 6: Set Up Real-Time Updates and Automation
Automate data refresh by connecting your dashboard to live data sources where possible. Real-time or near-real-time updates ensure decisions are based on the latest information and reduce manual workload and errors.
Step 7: Test, Iterate, and Roll Out
Pilot your dashboard with a small group of users to gather feedback on usability, accuracy, and relevance. Iterate improvements accordingly, then gradually roll it out organization-wide. Provide training and documentation to maximize adoption and impact.
The ideal solution not only integrates your diverse data sources seamlessly but also empowers users across your organization with intuitive self-service analytics and advanced AI-driven insights. This is where INSIA excels.
Transforming Financial Dashboards through INSIA’s AI-Powered Analytics
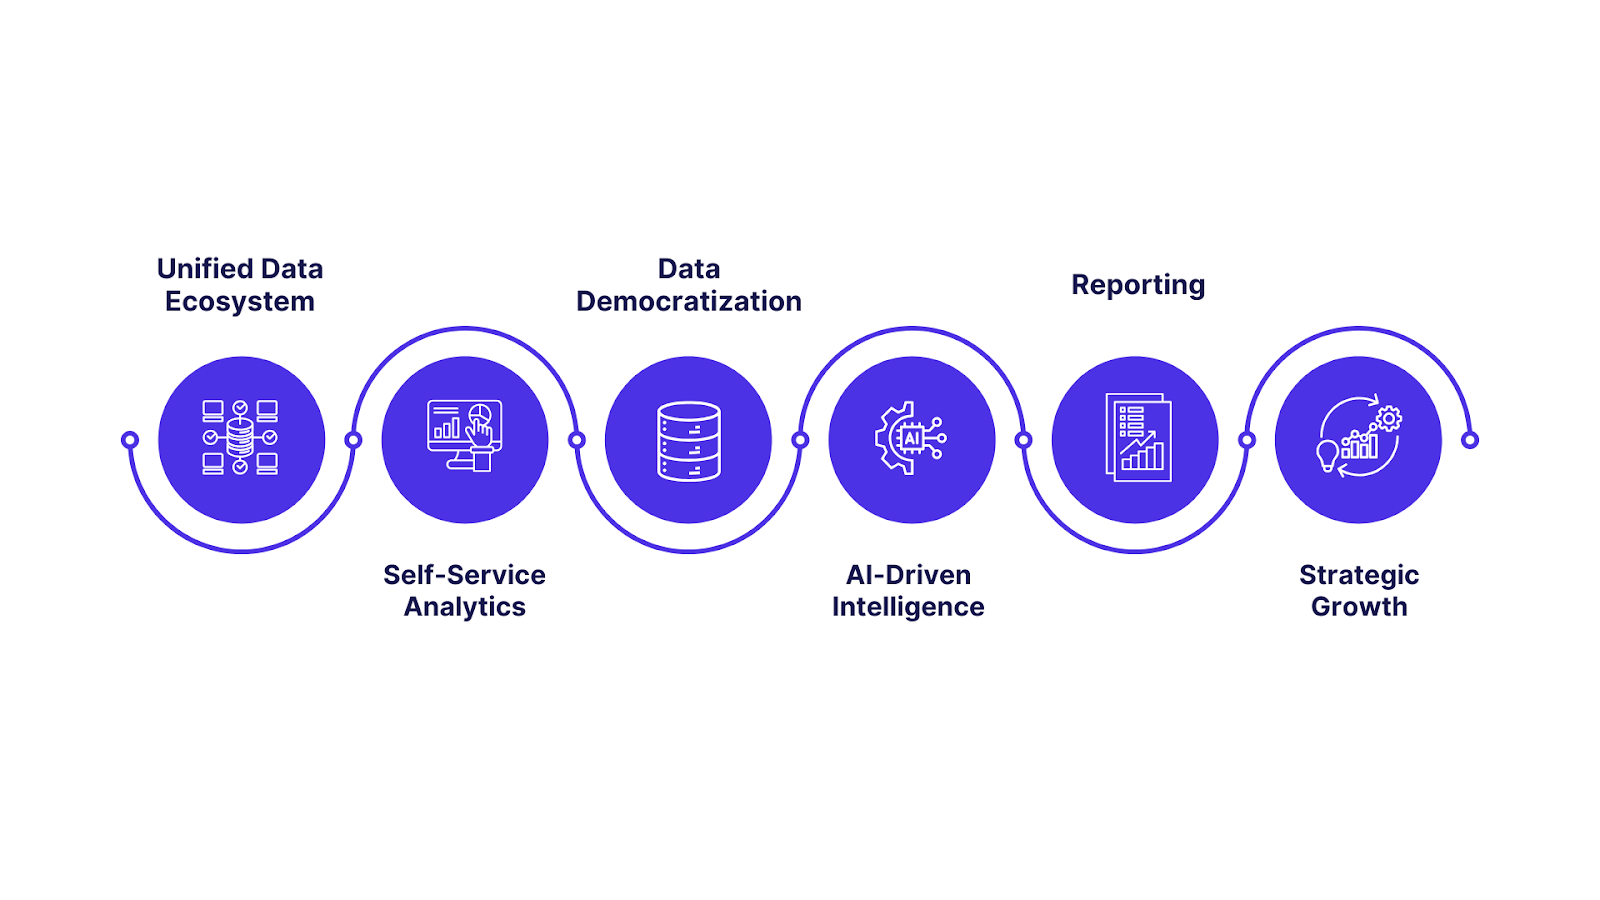
Financial dashboards today must do more than just display numbers, they need to empower every user with actionable, real-time insights. INSIA transforms traditional dashboards into dynamic, intelligent platforms by integrating data seamlessly, enabling self-service analytics, and applying advanced AI for smarter decision-making.
1. Unified Data Ecosystem
- Integrates data from over 20 sources including ERPs, CRMs, spreadsheets, and APIs into a single, reliable dashboard.
- Eliminates silos to provide a consistent, up-to-date financial view for all stakeholders.
2. Self-Service Analytics for All Users
- Intuitive drag-and-drop interface combined with natural language querying lets both technical and non-technical users create, customize, and explore dashboards independently.
- Accelerates insights and answers pressing questions instantly without relying on IT or specialists.
3. Data Democratization with Secure, Role-Based Access
- Role-specific permissions ensure executives, managers, and frontline staff access insights tailored to their responsibilities.
- Promotes a culture of data-driven decision-making while maintaining strict data security and governance.
4. Advanced AI-Driven Intelligence
- Provides not just descriptive reporting but predictive forecasts, risk detection, and anomaly alerts.
- Helps anticipate trends in cash flow, profitability, and expenses, allowing proactive business strategies.
5. Automated, Real-Time Updates and Reporting
- Automates data refreshes, report distribution, and alerting to keep dashboards current with minimal manual effort.
- Ensures decision-makers receive timely, accurate financial intelligence.
6. Driving Business Agility and Strategic Growth
- Transforms raw financial data into insightful narratives and foresight.
- Empowers organizations to respond swiftly to market changes, optimize resource allocation, and unlock growth opportunities.
INSIA redefines the financial dashboard experience by making sophisticated analytics accessible to all users. It does this through self-service, AI-powered platforms that encourage collaboration, efficiency, and smarter financial decisions.
Best Practices for Dashboard Success
Effective financial dashboards align teams, and foster strategic action. To ensure your dashboards deliver maximum value, follow these best practices:
1. Align Dashboards with Strategic Goals
- Ensure your dashboard reflects core business priorities and objectives.
- Select metrics and KPIs that directly support your organization’s strategy.
- Avoid including irrelevant data that doesn’t contribute to key goals.
2. Keep It Action-Oriented
- Focus on metrics that drive actionable insights and decision-making.
- Highlight trends, alerts, and performance gaps to prompt timely responses.
- Design dashboards to encourage users to take specific next steps.
3. Prevent Data Overload
- Limit information to what is truly relevant and meaningful for each audience.
- Avoid clutter by prioritizing key KPIs and summarizing details with drill-down options.
- Use visual hierarchy, whitespace, and clear labeling for readability.
4. Ensure Data Quality and Governance
- Establish standards for data accuracy, consistency, and timeliness.
- Implement regular audits and validation processes to maintain trust in dashboard data.
- Ensure data sources are well-integrated and updated in real time wherever possible.
5. Regular Reviews and Updates
- Schedule frequent dashboard reviews to confirm relevance as business conditions change.
- Collect user feedback to identify improvement opportunities.
- Refresh metrics, layouts, and data sources periodically to maintain usefulness.
Common Mistakes to Avoid
- Overloading with Data: Providing too much information can overwhelm users and obscure insights.
- Lack of Context: Present KPIs with clear labels, benchmarks, or comparisons to enhance understanding.
- No Real-Time Updates: Stale data leads to outdated decisions; automate refreshes when possible.
- Ignoring User Needs: Dashboards that don’t reflect end-user requirements see low adoption and effectiveness.
- Poor Visual Design: Confusing layouts, inconsistent colors, or clutter reduce comprehension and trust.
Conclusion
Financial dashboards transform complex financial data into clear, actionable insights, enabling smarter, faster decision-making across all levels of an organization. They unify data sources, provide real-time updates, and focus on key metrics aligned with strategic goals.
Begin by defining your dashboard objectives and selecting relevant KPIs that reflect your business priorities. Use templates or tools as a starting point, and involve finance or BI professionals to ensure your dashboards deliver meaningful value from the outset.
INSIA’s AI-powered platform simplifies dashboard creation with real-time data integration, self-service analytics, and predictive insights. Empower your teams with smarter financial intelligence that automates reporting and evolves with your business needs.