A staggering 73% of businesses now rely on revenue analytics to shape growth strategies. Those using AI-powered tools are seeing revenue lift by as much as 25% compared to those sticking with traditional methods.
The numbers reflect a clear message: making sense of revenue data is no longer reserved for tech giants or analytics teams, it impacts everyone with a stake in results. Revenue analytics today isn’t just about measuring the past; it’s the key to unlocking opportunities, predicting outcomes, and making every decision count.
Real-time insights, advanced forecasting, and unified views across sales, marketing, and finance have become the baseline for smarter, faster business moves.
As technology evolves, so does the ambition behind every revenue conversation. Revenue analytics now means going beyond “what happened” into understanding “why” and “what’s next”, helping identify precise actions that drive measurable, predictable growth.
This blog explores how revenue analytics transforms raw numbers into practical, real-world impact.
At a Glance
- Revenue analytics involves using data to optimize a business's revenue generation, enhance profitability, and support data-driven decisions across sales, marketing, and finance.
- By analyzing customer behavior, identifying sales opportunities, and improving forecasting, businesses can unlock growth and predict future outcomes.
- Key benefits include better understanding of customer preferences, optimizing recurring revenue models, and setting realistic revenue goals based on actionable insights.
- The process involves setting clear goals, centralizing data, analyzing trends, and continuously optimizing strategies to drive smarter, more profitable decisions.
What Is Revenue Analytics?
Revenue analytics involves collecting, analyzing, and interpreting data related to a business’s revenue generation.
The goal is to gain insights that increase profitability, improve forecasting, and support data-driven decisions.
It looks at sales data, customer behavior, pricing, product performance, and market trends to understand how a business earns revenue and where it can optimize these streams for better financial outcomes.
Main Goals of Revenue Analytics
- Increasing Profitability: By analyzing revenue drivers and customer segments, companies can identify high-margin products, improve pricing strategies, and reduce costs, maximizing profits.
- Improving Forecasting: Leveraging detailed and real-time revenue data, revenue analytics helps produce more precise revenue forecasts and budgets, leading to better planning and resource allocation.
- Making Data-Driven Decisions: It provides insights that empower leaders to make strategic decisions about sales tactics, marketing focus, and operational improvements based on quantifiable facts rather than intuition.
Synonyms and Related Concepts
- Revenue Intelligence: Often used interchangeably with revenue analytics but may emphasize the continuous monitoring and real-time insight generation over revenue activities and pipeline management.
- Revenue Optimization Analytics: Focuses specifically on maximizing revenue through optimization techniques such as pricing models, demand forecasting, and customer retention strategies.
Also Read: How to Perform Basic Cash Flow Analysis
Key Benefits of Revenue Analytics
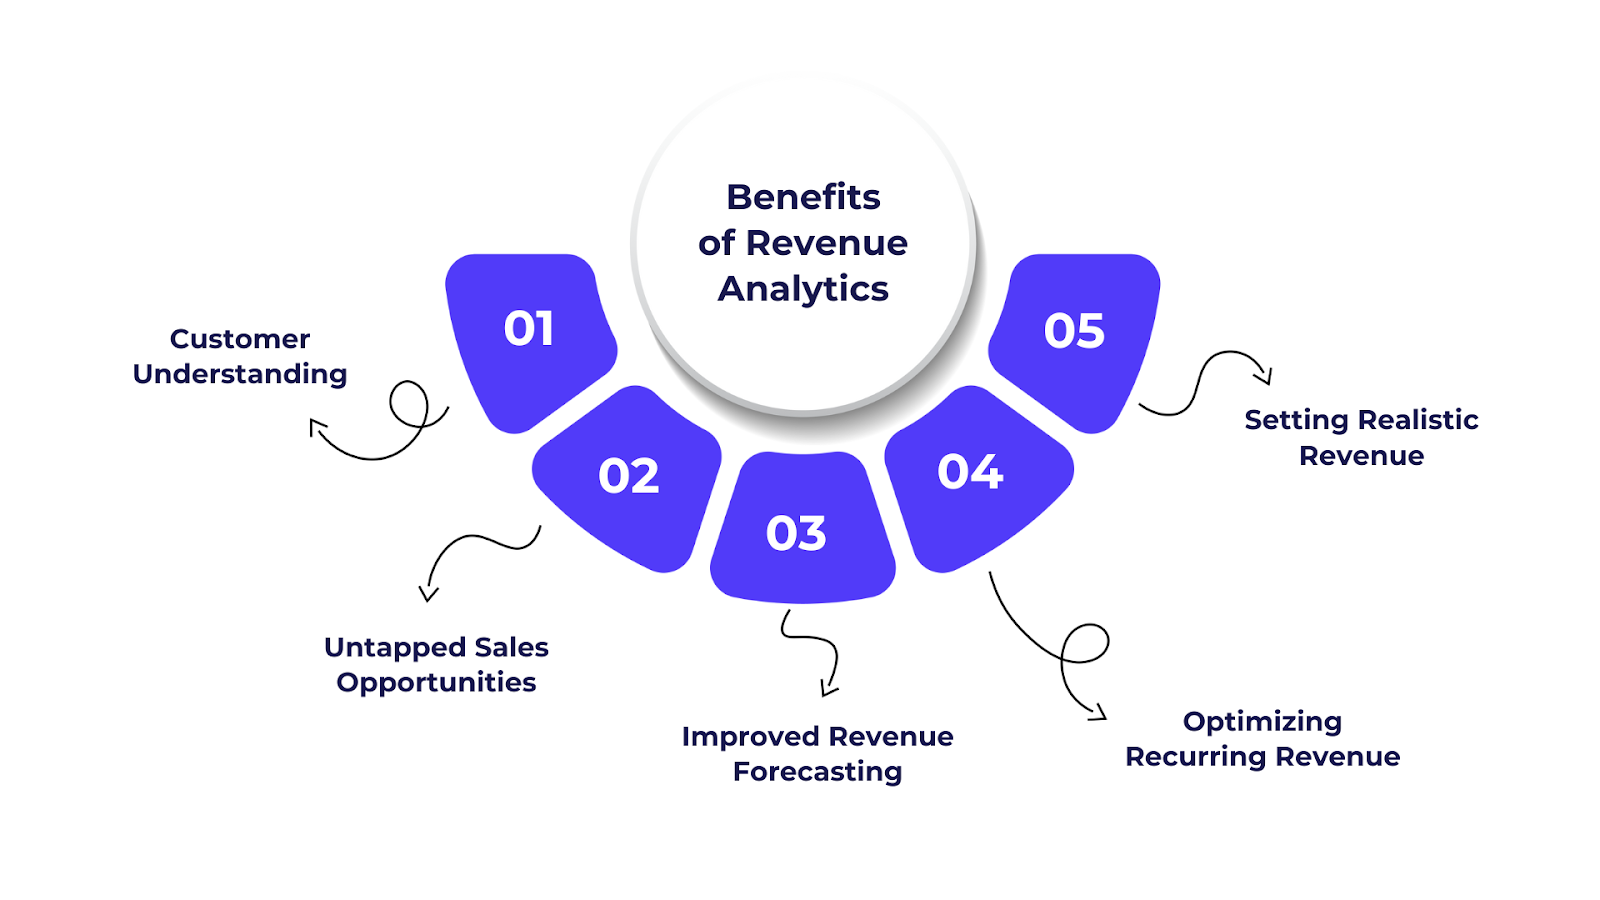
By providing accurate forecasts and real-time performance tracking, revenue analytics enables smarter decision-making, reduces revenue leakage, and improves overall financial health.
1. Customer Understanding and Behavior Analysis
Revenue analytics provides deep insights into customer preferences, buying habits, and segmentation by analyzing multiple layers of customer data such as purchase history, interactions, and engagement patterns. This enables businesses to:
- Predict what customers will want next and when, allowing precise targeting and timely offers.
- Identify which customer segments respond best to upselling or cross-selling, increasing sales efficiency.
- Detect early warning signs of dissatisfaction to proactively reduce churn.
These behavior insights reveal actionable patterns that optimize product recommendations, personalized marketing, and customer journey improvements, ultimately driving revenue growth.
2. Identifying Untapped Sales Opportunities
By systematically analyzing revenue data, businesses can uncover new or underserved market segments, seasonal trends, and hidden revenue streams. Revenue analytics highlights smaller, buried revenue opportunities that static reporting or human intuition might miss.
For example, spotting peak sales periods or niche customer groups helps companies plan campaigns and inventory better to maximize revenues.
3. Improved Revenue Forecasting
Revenue analytics uses predictive analytics models to create precise revenue forecasts. Unlike traditional methods, it leverages detailed real-time data points such as customer segment performance, sales cycle trends, and product profitability.
This leads to more accurate budgeting and strategic planning, enabling organizations to anticipate market fluctuations, allocate resources smartly, and set realistic revenue targets.
4. Optimizing Recurring Revenue Models
For subscription-based or recurring revenue businesses, analytics provides insights into subscription lengths, upsell potentials, and churn drivers.
Understanding these factors allows companies to tailor subscription plans, optimize pricing, and implement retention strategies that enhance customer lifetime value and reduce revenue leakage.
5. Setting Realistic Revenue Goals
Data-backed revenue analytics helps companies design achievable revenue goals by grounding budgeting and strategy in actual performance metrics and market conditions.
This prevents unrealistic targets and supports competitive positioning, efficient resource allocation, and measurable growth tracking.
Also Read: Effective Techniques for Warranty Fraud Analytics
Next, let’s walk through a straightforward, step-by-step guide on how to implement revenue analytics effectively in your organization, helping you move from data to impact with confidence and clarity.
Step-by-Step: How to Implement Revenue Analytics
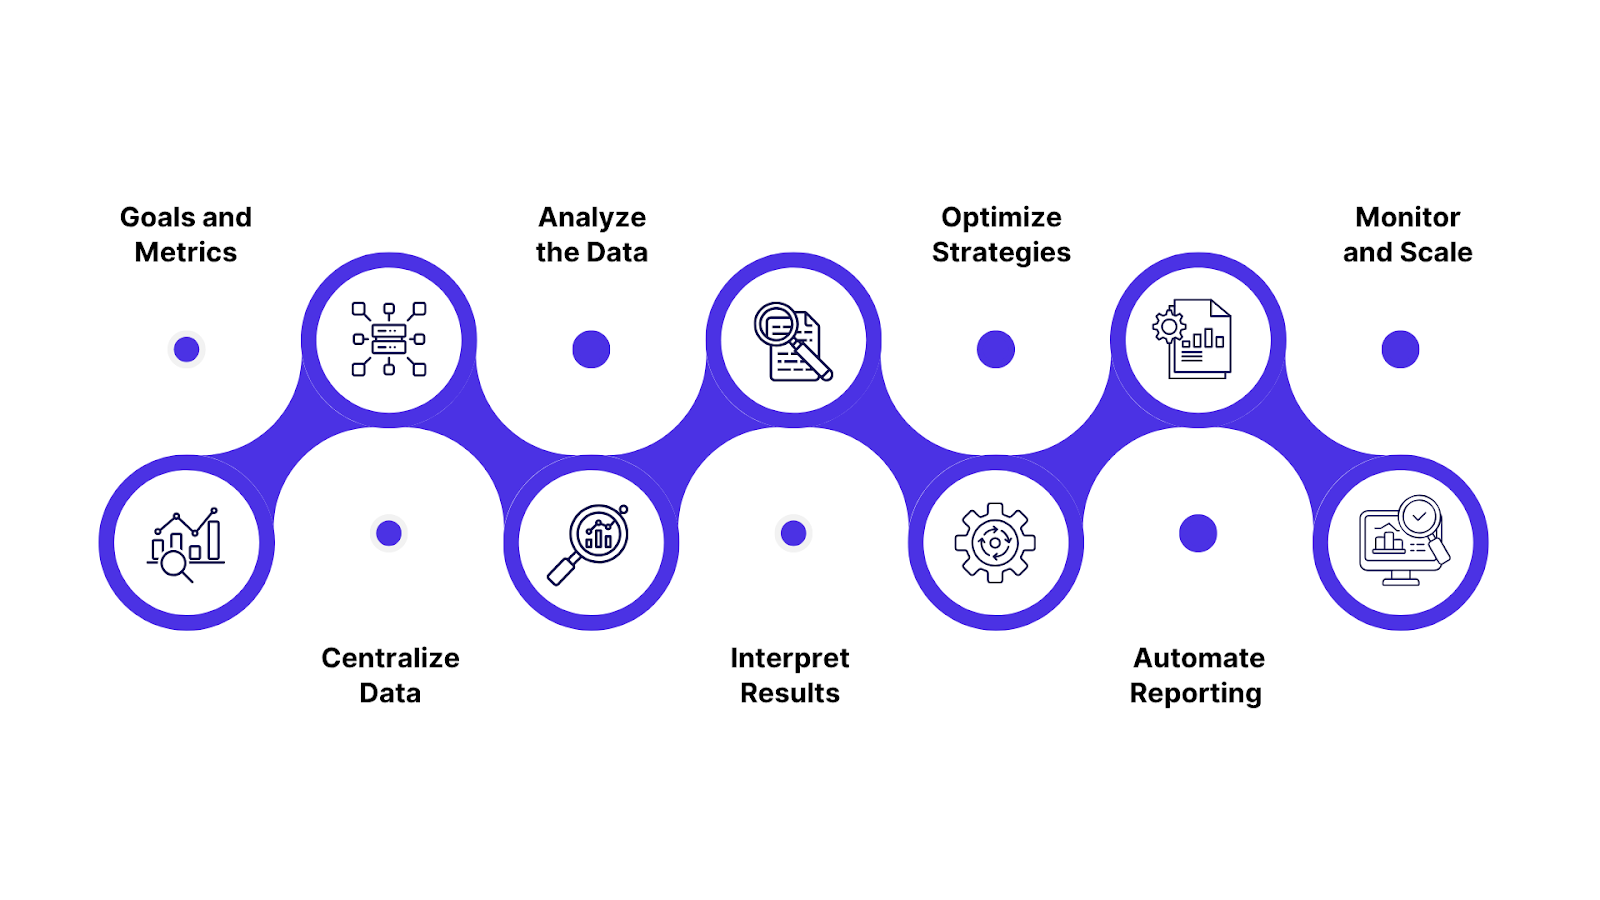
Implementing revenue analytics is a systematic process that transforms raw data into actionable business insights, empowering smarter decisions and fueling growth. Here’s a structured, practical step-by-step approach:
Step 1: Define Goals and Metrics
Set clear objectives for your revenue analytics initiative. Are you aiming to boost profitability, improve forecasting, identify revenue leakage, or optimize specific revenue streams?
Determine the key performance indicators (KPIs) and metrics aligned to your goals, such as revenue growth rate, customer lifetime value (CLV), churn rate, or average deal size.
Step 2: Collect and Centralize Data
Gather all relevant revenue-driving data from sources such as sales platforms, CRM, billing, marketing, and financial systems. Centralize this data into an integrated platform or data warehouse to ensure consistency and a single source of truth. Pay special attention to cleaning and standardizing the data to eliminate errors and redundancies.
Step 3: Analyze the Data
Utilize analytics tools or platforms, ideally, those with AI and visualization capabilities, to process and analyze the data. Examine trends across customer segments, channels, products, and time periods. Drill down to understand what’s driving revenue up or down, and run predictive models to forecast future performance.
Step 4: Interpret Results and Glean Insights
Translate analysis into meaningful insights. This could involve segmenting customers based on behavior, identifying underperforming products, or pinpointing high-growth opportunities. Use the data to validate hypotheses, spot anomalies, and refine strategies for pricing, positioning, or customer retention.
Step 5: Take Action and Optimize Strategies
Develop and implement action plans based on your insights. For instance, launch targeted marketing campaigns, refine sales tactics, or adjust subscription models and pricing. Modern platforms make it easy to experiment (A/B testing, campaign tweaks) and measure the direct impact of changes.
Step 6: Automate Reporting and Share Insights
Set up dashboards and automated reporting to provide real-time, role-specific insights to stakeholders across sales, marketing, finance, and operations. This fosters continuous collaboration, fast response to trends, and organization-wide alignment on revenue goals.
Step 7: Monitor, Iterate, and Scale
Revenue analytics is not a one-off project. Continuously monitor key metrics, gather feedback, study results, and iterate your approach. Regularly update data sources, refine models, and expand analytics capabilities as your business evolves.
Additional Tips
- Invest in training teams on analytics tools and best practices.
- Overcome data quality and integration challenges proactively.
- Prioritize security, compliance, and proper access controls.
In particular, business-to-business (B2B) and business-to-consumer (B2C) models differ significantly in customer dynamics, pricing approaches, and strategic priorities.
Understanding these distinctions is key to effectively leveraging revenue analytics to maximize growth and profitability.
The Role of Revenue Analytics Across Business Models
Revenue analytics plays a critical role in shaping strategies and optimizing outcomes for different types of businesses.
Its application varies depending on the business model, specifically between B2B (Business-to-Business) and B2C (Business-to-Consumer), reflecting differing customer dynamics, revenue drivers, and strategic priorities.
B2B Applications
In B2B environments, revenue analytics primarily focuses on maximizing long-term value from a smaller number of high-value clients. Key areas of emphasis include:
- Customer Lifetime Value (CLV): Analytics helps accurately calculate the total value a client brings over the duration of their relationship, guiding investment in retention and account growth strategies.
- Product Pricing and Quality: Insights from revenue data enable businesses to tailor pricing models based on volume contracts, negotiate effectively, and ensure product quality matches client expectations.
- Tailored Pricing Strategies: Personalized pricing approaches consider contract length, discounts, and service levels to maximize profitability.
- Improving Client Relationships: Analytics uncovers usage patterns and satisfaction drivers, allowing proactive management of renewal risks and identification of upsell or cross-sell opportunities.
B2C Applications
B2C businesses leverage revenue analytics to understand consumer behavior at scale and optimize marketing and sales efforts. Focus areas include:
- Marketing Strategies and Promotions: Data-driven insights inform campaign timing, effectiveness, and targeting to increase conversion and customer acquisition.
- Customer Purchase Behavior: Analyzing purchase frequency, basket size, and product preferences enables personalization of offers and enhanced customer engagement.
- Channel Preferences: Understanding which sales channels customers prefer (online, mobile, in-store) optimizes resource allocation and channel marketing investments.
Comparative Overview Chart:
| Aspect | B2B Focus | B2C Focus |
|---|---|---|
| Customer Relationship | Long-term, high-value clients | Large volume, frequent individual buyers |
| Revenue Drivers | Customer lifetime value, contract pricing | Promotions, seasonal demand, product affinity |
| Pricing Strategies | Negotiated pricing, volume-based | Dynamic pricing, discounts, bundles |
| Analytics Goals | Retention, upsell, churn reduction | Personalization, engagement, channel mix |
| Key Outcomes | Improved client loyalty and profitability | Increased conversion and customer loyalty |
Also Read: Understanding Retail Analytics: Key Insights and Practices
With a clear understanding of why revenue analytics matters, the next step is knowing which specific metrics to track. Key Performance Indicators (KPIs) give you measurable insights into your revenue health and help focus your efforts where they matter most.
Key Revenue Analytics Metrics (KPIs)
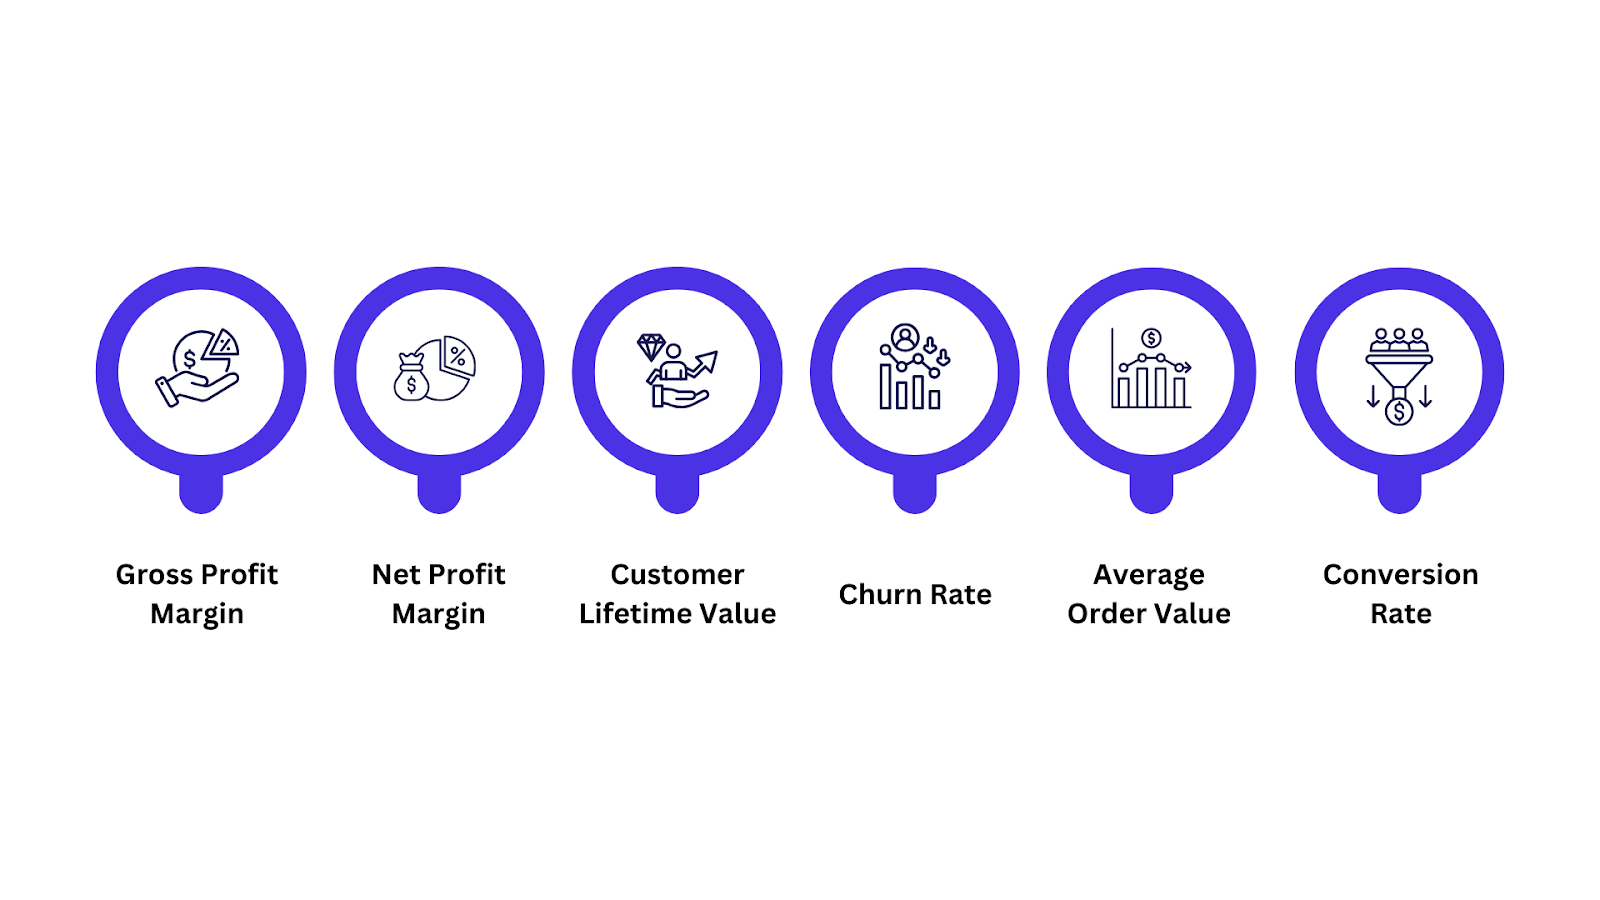
Revenue analytics revolves around measuring and optimizing fundamental metrics that directly impact a company’s financial health, customer relationships, and operational efficiency. Here are the most essential KPIs to track:
1. Gross Profit Margin
Measures how much of the revenue remains after subtracting the cost of goods sold (COGS). It shows the efficiency in producing and selling products, indicating the percentage of revenue that contributes to profit.
Formula: ( Net Sales − COGS ) / Net Sales × 100 % (Net Sales−COGS) / Net Sales×100%
2. Net Profit Margin
Reflects overall profitability by calculating the percentage of revenue left after all expenses, taxes, and costs are deducted. It indicates the true earning potential of the business.
Formula: Net Income / Revenue × 100 % Net Income/Revenue×100%
3. Customer Lifetime Value (CLV)
Estimates the total revenue a business can expect from a single customer account throughout their entire relationship. It helps prioritize customer retention and personalized marketing strategies. Higher CLV correlates with better profitability.
4. Churn Rate
Tracks the rate at which customers stop doing business with the company over a specified period. It is critical for identifying retention issues and impacts recurring revenue models significantly.
5. Average Order Value (AOV)
Calculates the average amount customers spend per transaction. Optimizing AOV through upselling or cross-selling can effectively increase total revenue without acquiring new customers.
6. Conversion Rate
Measures the percentage of leads or prospects that convert into paying customers. It reflects the efficiency of sales and marketing efforts in driving revenue growth.
Additional Important Metrics:
- Return on Investment (ROI): Measures the profitability of marketing or sales investments.
- Customer Acquisition Cost (CAC): The average cost to acquire a new customer, valuable for understanding efficiency of marketing spend.
- Monthly Recurring Revenue (MRR) / Annual Recurring Revenue (ARR): Key for subscription models, showing predictable revenue streams.
- Closed-Won Rate: Percentage of deals successfully closed, important for sales pipeline health analysis.
Let’s explore and compare some of the leading revenue analytics tools in 2025, highlighting their standout features and ideal use cases. This will help you find the solution that best fits your business needs and helps you unlock the full value of your revenue data.
Top Tools for Revenue Analytics (with comparison)
Modern revenue analytics platforms combine advanced features and capabilities to help businesses capture, analyze, and act on revenue data more effectively.
Here is a detailed comparison of top revenue analytics tools for 2025, highlighting their key features, ideal use cases, and pricing where available.
| Tool | Best For | Key Features |
|---|---|---|
| INSIA.ai | Small to mid-sized businesses | No-code, drag-and-drop data integration; real-time dashboards; AI-powered predictive analytics; Push AI insights; integrates 30+ sources including ERP & CRM; intuitive search-based analysis. |
| Nektar | Revenue operations & CRM automation | AI-driven data capture with 95%+ accuracy; full-funnel pipeline visibility; rapid deployment; contextual insights hub. |
| Salesforce CRM Analytics | Enterprise revenue management | Predictive and prescriptive analytics; unified, customizable dashboards; natural language search; real-time departmental reporting; deep industry-specific features. |
| InsightSquared | Enterprise sales analytics | Real-time dashboards; custom reporting; AI-powered forecasting and pipeline health insights; integrates seamlessly with Salesforce, HubSpot, and more. |
| Gong | Conversation and deal analytics | AI call transcription and analysis; pipeline health insights; risk and churn prediction; multilingual support; sales coaching dashboards. |
| Chorus.ai | Sales coaching & market intelligence | Real-time sales conversation analysis; language and risk detection; coaching dashboards for sales teams. |
| Aviso | AI-powered forecasting and RevOps | Multi-signal AI forecasting; NLP interface; deal risk and opportunity insights; mobile app dashboards. |
| Baremetrics | SaaS subscription analytics | Subscription monitoring; churn prediction; revenue recovery tools; cohort analysis; recurring revenue forecasting. |
| Chargebee | Subscription billing & analytics | Revenue tracking; churn monitoring; customizable dashboards; comprehensive subscription management. |
| ChartMogul | SMB SaaS analytics | Cohort analysis; revenue and churn metrics; deep integration with billing systems (e.g., Stripe); customizable dashboards. |
Also Read: AI and Big Data for Supply Chain Analytics
Next, let’s explore the key challenges in revenue analytics and practical strategies businesses can use to overcome them, helping you build a stronger foundation for success.
Common Challenges in Revenue Analytics & How to Overcome Them
1. Data Quality and Accuracy
Poor data quality such as duplicates, incomplete, or outdated records leads to inaccurate analysis and flawed decisions. Overcome this by enforcing data validation, cleansing, governance policies, and using AI tools to maintain clean, reliable data continuously.
How to Overcome:
- Enforce strict data validation and cleansing.
- Implement strong data governance with clear ownership and standards.
- Use AI-powered automation for real-time error detection and correction.
- Conduct regular audits to maintain data integrity.
2. Overcoming Data Silos
Revenue data spread across CRM, ERP, marketing, and billing systems creates fragmented views that hinder insights. Centralize data through integration platforms, encourage cross-team collaboration, and use low-code tools to simplify connecting disparate sources.
How to Overcome:
- Centralize data via integration platforms or unified warehouses.
- Promote cross-department collaboration and shared data ownership.
- Deploy no-code/low-code tools for easy data connection without IT dependency.
3. Technical Barriers
Complex pricing models, legacy infrastructure, and skills gaps slow analytics tool adoption and effectiveness. Address this by choosing no-code platforms, investing in scalable tech, providing training, leveraging vendor support, and starting with pilot projects to refine workflows.
How to Overcome:
- Adopt scalable, cloud-based infrastructure to handle data volume and speed.
- Choose user-friendly, no-code analytics platforms to simplify adoption.
- Provide targeted training to build analytics skills internally.
- Use vendor support and start with pilot projects to refine implementation.
Next, let’s explore Revenue Analytics by Industry, highlighting how various sectors benefit from revenue analytics and what makes their approaches distinct.
Benefits of using Revenue Analytics in Industry
Revenue analytics delivers industry-specific value by addressing the unique revenue drivers, customer behaviors, and operational complexities of each sector. Here is an overview of how revenue analytics benefits key industries and what differentiates their applications:
1. SaaS (Software as a Service)
- Focus: Subscription revenue models, customer lifecycle value, churn reduction, and usage-based pricing.
- Benefits:
- Precise tracking of Monthly Recurring Revenue (MRR) and Annual Recurring Revenue (ARR).
- Predictive analytics for subscriber churn and upsell opportunities.
- Insights into product feature adoption to drive customer success and retention.
- Key Differentiators: Heavy reliance on subscription metrics, cohort analysis, and real-time recurring revenue forecasting.
2. Retail and E-commerce
- Focus: Sales trends, promotions effectiveness, inventory turnover, and omnichannel channel performance.
- Benefits:
- Understanding customer purchase behavior and seasonal demand fluctuations.
- Optimizing pricing and promotional campaigns based on revenue impact.
- Integrating online and offline sales data to create unified customer views.
- Key Differentiators: Real-time sales and inventory analytics, granular product-level revenue tracking, and promotion ROI analysis.
3. Manufacturing
- Focus: Product profitability, contract pricing, supply chain impact on revenue, and order fulfillment performance.
- Benefits:
- Analyzing revenue contribution by product lines and customer segments.
- Monitoring contract compliance and pricing variance.
- Connecting production metrics to revenue outcomes for cost control.
- Key Differentiators: Integration with ERP systems for detailed cost and revenue linkage, contract to revenue tracking, and long sales cycles with complex pricing.
4. Healthcare
- Focus: Patient revenue streams, payer contracts, service line profitability, and regulatory compliance.
- Benefits:
- Tracking revenue by service, patient demographics, and insurance reimbursements.
- Managing revenue cycle efficiency and reducing billing errors.
- Forecasting payer payment trends and denials.
- Key Differentiators: Compliance-driven revenue recognition, multi-payer environment complexities, and focus on service-level profitability.
5. Media and Entertainment
- Focus: Advertising revenue, subscription models, content monetization, and audience segmentation.
- Benefits:
- Tracking multi-source revenues such as ads, subscriptions, and licensing.
- Analyzing audience engagement tied to revenue streams.
- Optimizing pricing for ad inventory and subscription tiers.
- Key Differentiators: Complex multi-channel and multi-product revenue streams, fast-changing audience behavior, and flexible pricing models.
6. Finance and Banking
- Focus: Interest income, fee-based revenues, asset management, and risk-adjusted pricing.
- Benefits:
- Analyzing revenue streams across loans, investments, and advisory services.
- Monitoring profitability by customer segment and product.
- Using predictive risk analytics to forecast revenue impact of market conditions.
- Key Differentiators: Regulatory reporting integration, risk-based revenue forecasting, and strong emphasis on compliance and auditability.
Also Read: Financial Data Analysis: Types, Methods, and Examples
Unlocking Growth with Smarter Revenue Decisions
Growing your business starts with making smarter revenue decisions. When you use revenue analytics, you turn complex financial and customer data into clear insights.
This helps you understand what your customers want, spot new opportunities, and set prices that really work. With better forecasting, you can plan ahead confidently and make sure every dollar counts.
In simple terms, revenue analytics helps you:
- See the full picture of your revenue and customer behavior.
- Find hidden chances to grow and improve.
- Predict where your business is headed.
- Adjust pricing and offers for better profits.
- Set goals that are realistic and data-driven.
By making these insights part of your daily decisions, you build a stronger, more profitable business that’s ready for the future.