In an age where every business decision hinges on data, financial data analysis has emerged as the critical compass guiding companies toward sustainable growth. According to a report by Deloitte, 72% of organizations are prioritizing data and analytics as a key part of their business strategy in 2025, underscoring the importance of financial data in achieving sustainable growth. With the growing reliance on data-driven insights, it is essential for organizations to harness the power of financial data analysis to understand market trends, optimize financial performance, and drive informed decision-making.
In this article, we will explore the types and methods of financial data analysis, along with real-world examples and best practices for leaders looking to harness the power of financial data for their business strategies. Let’s dive into the world of financial data analysis and see how it can transform your business approach.
Why Financial Data Analysis is the CFO’s Secret Weapon
CFOs today are expected to drive business strategy, optimize cash flow, and enable profitable growth. With the accelerating complexity and speed of business, financial data analysis is rapidly becoming the CFO’s secret weapon—transforming static numbers into strategic insights that power better decisions.
The Problem: Fragmented Data and Slow Decision-Making
- Disparate systems keep critical financial data isolated
- Manual data gathering leads to reporting delays and increases the risk of error
- Traditional decision-making often relies on historical data, missing real-time trends
The Solution: Technology-Driven Financial Data Analysis
A modern, unified data platform empowers CFOs to:
- Centralize data for a single source of financial truth
- Automate reporting to save hours on repetitive manual tasks
- Use AI-powered analytics to forecast trends and identify challenges before they impact results
Key Benefits for CFOs:
| Benefit | Description | Impact on Business |
|---|---|---|
| Improved Forecasting | Timely, accurate trends and cash flow projections | Supports agile planning and resource allocation |
| Proactive Risk Mitigation | Early warning of cash flow shortfalls or fraud risks | Protects business from financial shocks |
| Greater Productivity | Automation reduces manual workload | Finance teams can focus on strategy |
| Faster, Informed Decisions | Real-time insights from anywhere | Keeps business moving in volatile markets |
Also read: Unleashing Potential: The Vital Role of Business Intelligence (BI) in Transforming Your Business
CFOs Are Prioritizing Analytics and Digital Transformation
According to the Deloitte CFO Signals 4Q 2023 report, 76% of CFOs expect digital transformation and advanced technologies—including AI and data analytics—to play a greater role in 2024. This high priority reflects the clear recognition that data-driven insights are essential for sustaining financial performance, controlling costs, and delivering on growth initiatives.
Why This Matters:
Financial data analysis enables a shift from backward-looking reporting to proactive, predictive insights. CFOs utilizing advanced analytics and automation are not just keeping pace—they’re setting the standard for modern, resilient financial leadership.
Now that the strategic power of financial data analysis for CFOs is clear, let’s break down its fundamentals in the next section: Overview of Financial Data Analysis.
Overview of Financial Data Analysis
Financial data analysis is the process of evaluating and interpreting financial data to support decision-making and strategic planning in businesses. By utilizing data-driven insights, organizations can make informed decisions, improve operational efficiency, and drive business growth. In today’s agile market, financial data analysis plays a pivotal role in shaping business strategies, ensuring financial health, and providing transparency to stakeholders.
Importance of Financial Data Analysis Modern Business:
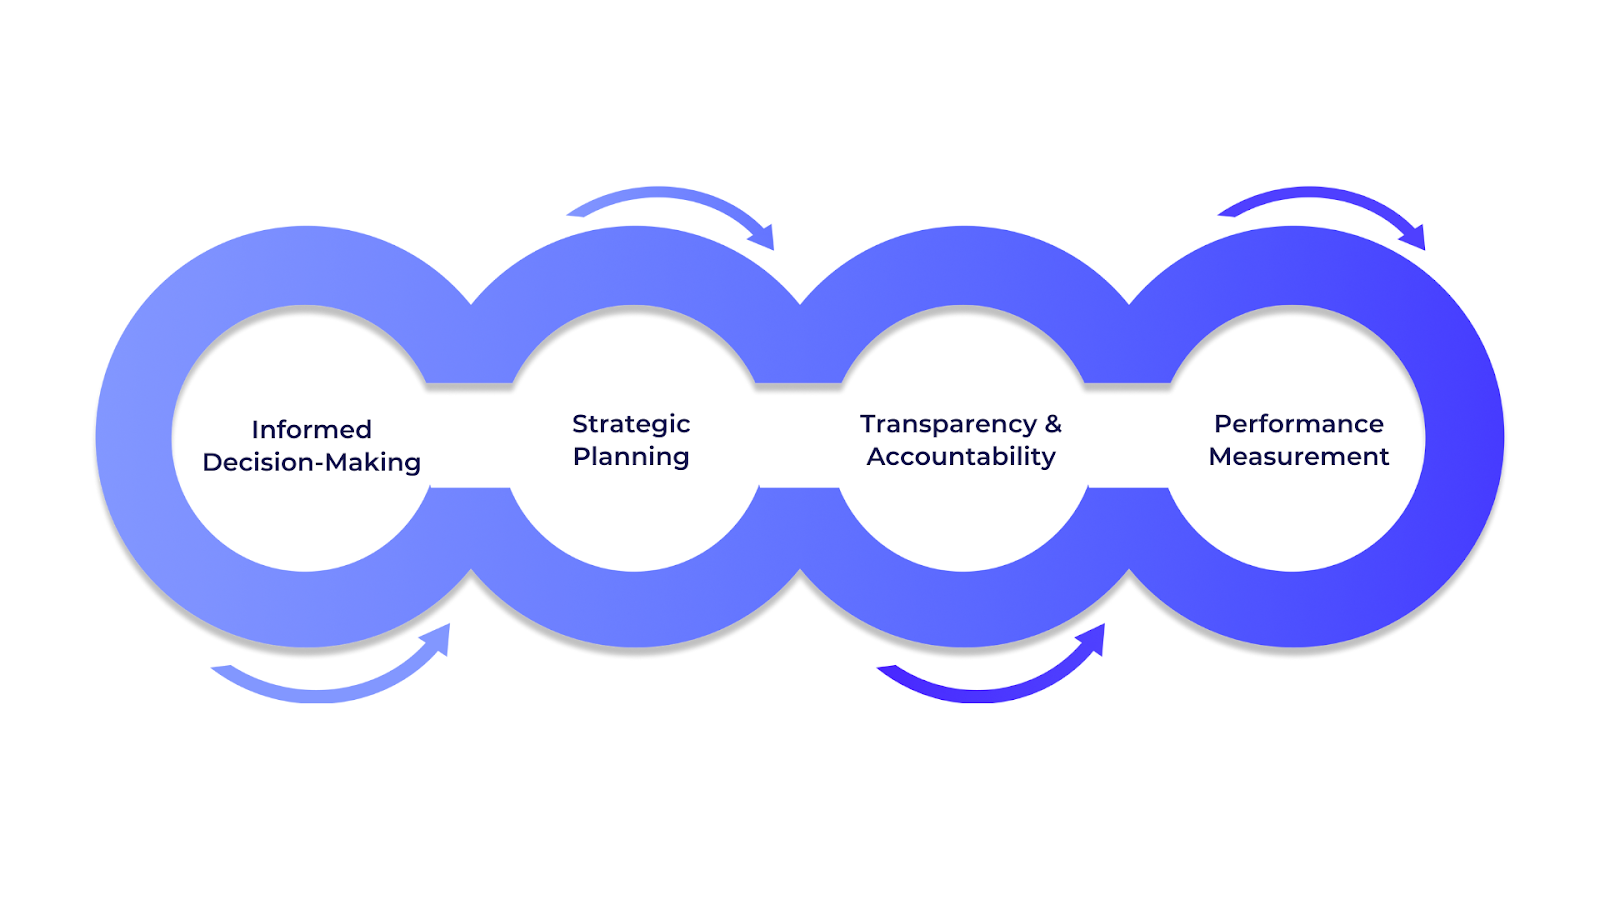
- Informed Decision-Making: Financial data analysis offers a clear understanding of a company’s financial standing, enabling decision-makers to allocate resources efficiently, prioritize initiatives, and maximize returns.
- Strategic Planning: By analyzing historical financial trends, businesses can forecast future performance, identify potential risks, and seize opportunities in a rapidly changing market.
- Transparency & Accountability: Accurate financial analysis helps ensure that companies meet compliance standards and maintain transparency, which is essential for building trust with stakeholders.
- Performance Measurement: It allows organizations to track their financial goals, compare them against benchmarks, and adjust strategies as needed to stay competitive.
The Role It Plays in Shaping Financial Strategies and Decision-Making Across Departments
Financial data analysis has become a strategic tool for shaping business decisions across various departments, especially in finance, marketing, and operations. By centralizing and automating data from multiple sources, businesses gain a comprehensive view of their financial health and operational efficiency.
- Finance: Financial data analysis allows CFOs and financial analysts to evaluate profitability, manage cash flow, identify cost-saving opportunities, and assess the overall financial performance of the business.
- Marketing: In marketing, financial data analysis helps measure the ROI of marketing campaigns, optimize marketing spend, and predict customer lifetime value. It allows marketing teams to make data-driven decisions that align with business goals.
- Operations: In operations, it aids in monitoring supply chain costs, inventory management, and production efficiency, ensuring that the company operates smoothly and meets customer demands without overspending.
Also read: Data Analysis: Generate Insights Like a Pro In 7 Steps
Financial data analysis allows departments to work cohesively by connecting financial goals with operational actions. This strengthens alignment across the business, facilitating better decision-making and more effective strategies.
As we now understand the significance of financial data analysis in decision-making, let's move ahead and look into Key Objectives of Financial Data Analysis.
Key Objectives of Financial Data Analysis
By understanding the key objectives behind financial data analysis, businesses can effectively evaluate their current standing, identify potential risks, and drive growth.
Understanding Business Performance
One of the primary objectives of financial data analysis is understanding how well a business is performing. By evaluating metrics like revenue, profit margins, and cash flow, financial data analysis provides insights into a company's financial health.
- Tracking Key Metrics: Financial analysis helps businesses monitor key performance indicators (KPIs) like profitability, liquidity, and solvency, providing a clear picture of their operational efficiency.
How INSIA Can Help: INSIA’s AI-powered platform allows businesses to centralize their financial data in real-time, ensuring that key metrics like profitability and cash flow are always accessible. With INSIA’s predictive analytics capabilities, businesses can continuously track and adjust these metrics, helping leaders stay ahead of potential issues and capitalize on opportunities.
- Real-time Performance Monitoring: Modern platforms, such as INSIA, provide businesses with real-time financial data, enabling quick adjustments and proactive decision-making.
How INSIA Can Help: INSIA’s seamless integration with multiple data sources means that financial data can be continuously updated in real time. With customizable dashboards, businesses can easily monitor their financial performance at any given moment, allowing for data-driven decisions without waiting for manual reports. This level of visibility ensures that organizations can act swiftly, whether it's to address a short-term financial concern or to seize a growth opportunity.
Evaluating Profitability, Risk, and Growth Potential
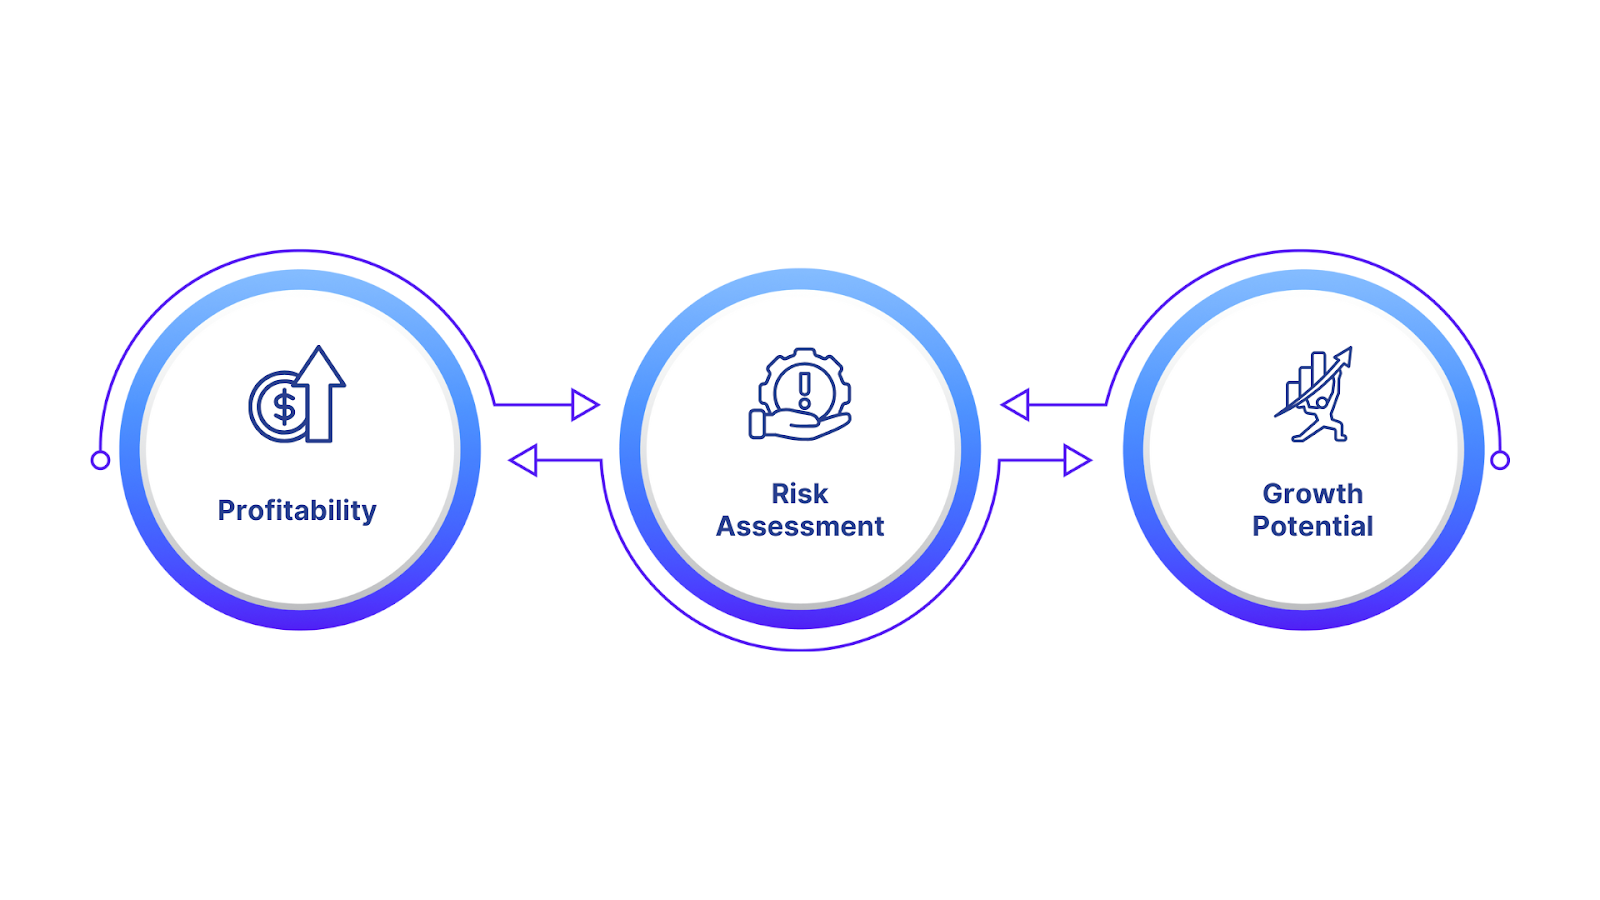
Financial data analysis also plays a crucial role in evaluating profitability, identifying risks, and assessing growth potential. It offers clarity on the company's capacity to generate income and manage expenditures effectively.
- Profitability: By analyzing income statements, financial data analysis helps determine profit margins and areas where businesses can cut costs or invest further to increase profitability.
How INSIA Can Help: INSIA’s real-time financial data tracking enables businesses to continually monitor their profitability and adjust strategies quickly to optimize earnings.
- Risk Assessment: Financial analysis identifies risks such as market fluctuations, credit risks, or operational inefficiencies, allowing organizations to implement risk mitigation strategies.
How INSIA Can Help: With predictive analytics, INSIA helps businesses forecast potential risks and take proactive measures, ensuring smooth operational flow and better risk mitigation.
- Growth Potential: Analyzing financial data over time allows businesses to forecast future performance and uncover growth opportunities, enabling them to make informed investments.
How INSIA Can Help: INSIA’s AI-powered insights provide businesses with forward-looking data, enabling them to uncover growth opportunities and make well-informed investments.
Improving Operational Efficiency and Cost Management
Another objective of financial data analysis is optimizing operations and managing costs. By closely monitoring financial records, businesses can identify inefficiencies, streamline operations, and allocate resources more effectively.
- Cost Reduction: Analyzing expenditures and operational costs helps businesses identify areas where they can reduce waste, negotiate better deals with suppliers, or eliminate inefficiencies.
How INSIA Can Help: INSIA’s real-time data analysis helps businesses spot cost-saving opportunities and streamline operations quickly, ensuring that funds are used efficiently.
- Resource Allocation: With detailed financial insights, businesses can allocate resources more effectively, ensuring that funds are directed toward high-priority projects and strategies.
How INSIA Can Help: INSIA’s AI-driven insights help businesses make data-backed decisions, optimizing resource allocation and ensuring funds are directed toward critical growth areas.
By enhancing operational efficiency and reducing costs, financial data analysis helps organizations maximize their profitability while ensuring sustainable growth.
Now that we have covered the key objectives of financial data analysis, let’s explore the components involved in financial data analysis to better understand its structure and effectiveness in supporting business decisions.
Components Involved in Financial Data Analysis
To truly understand financial data analysis, several key components must come together to deliver actionable insights. These components include financial data sources, the tools and systems used for processing data, and the types of insights provided. Together, they help businesses analyze their financial health and make informed, data-driven decisions.
Financial Data Sources (Internal and External)
Financial data is gathered from a variety of internal and external sources to provide a comprehensive overview of a company's financial position.
- Internal Data:
- Company reports
- Transaction logs
- Accounting records
- Profit and loss statements
- Balance sheets
- External Data:
- Market reports
- Economic data
- Industry benchmarks
- Competitor financials
By making use of both internal and external data, financial data analysis offers a complete view of a company's performance in relation to market dynamics, economic trends, and industry standards.
Tools and Systems Used for Processing Data
The effectiveness of financial data analysis depends heavily on the tools and platforms used to process and analyze the data. Modern BI platforms like INSIA play a significant role in this process.
- INSIA:
- Centralizes data from various sources into one platform.
- Automates insights generation, reducing manual effort and time spent on data aggregation.
- Uses AI/ML algorithms to provide real-time insights, predictive analytics, and actionable recommendations.
These platforms allow businesses to seamlessly process large volumes of data, improve decision-making speed, and ensure accuracy across all financial data points.
Insights Provided by Financial Data Analysis
The core of financial data analysis lies in extracting valuable insights that help businesses understand their financial health.
- Profitability: Financial data analysis identifies profit margins, return on investment (ROI), and net income, helping businesses evaluate their ability to generate profits.
- Liquidity: Analyzing cash flow and liquidity ratios provides businesses with insights into their ability to meet short-term obligations.
- Solvency: Assessing solvency ratios such as debt-to-equity helps businesses understand their long-term financial stability.
With the right tools, like INSIA, businesses can monitor and improve these key financial metrics, enabling better decision-making across all levels of the organization.
Also read: Comprehensive Guide to Business Intelligence Dashboards
As we explore further, let’s dive into the Types of Financial Data that form the basis of these analyses and how businesses can effectively use them.
Types of Financial Data
Before diving into the finer points of financial data analysis, it's helpful to get a clear view of the foundational data types that shape the financial decision-making process. There are several types of data that businesses rely on to evaluate their financial health. Understanding these categories sets the stage for more advanced insights and helps clarify how each contributes to a complete financial picture.
Below is a quick comparison table summarizing the core types of financial data that organizations commonly use. This overview will serve as a reference point before we examine each type in greater detail later in this section.
Breaking Down Financial Data Types: A Concise Comparison Table
| Data Type | Definition | Example |
|---|---|---|
| Quantitative Data | Numeric, measurable values | Revenue, expenses, cash flow |
| Qualitative Data | Non-numeric, descriptive information | Customer feedback, management notes |
| Historical Data | Past performance metrics | Last quarter’s sales data |
| Real-time Data | Live-streamed metrics | Live cash balance, stock prices |
| Structured Data | Organized in rows/columns | Excel spreadsheets, databases |
| Unstructured Data | Free-form or non-tabular data | PDFs, invoices, emails |
Understanding these types helps organizations make data-driven decisions and align their strategies accordingly. So let’s get into the details now.
Quantitative Financial Data
Quantitative financial data refers to numerical data that provides measurable insights into a company’s financial performance like:
- Sales
- Revenue
- Profit Margins
- Cash Flow
- Operating Expenses
How Quantitative Data Is Used to Measure Financial Performance:
Quantitative data is crucial for evaluating business performance by providing concrete numbers that represent operational success. For instance:
- Revenue indicates overall business success, and profit margins show how efficiently a company is converting sales into profits.
- Cash flow analysis is essential for determining a company’s liquidity and ability to pay short-term obligations.
- Sales data allows businesses to track growth and assess product performance in the market.
Using platforms like INSIA, businesses can centralize quantitative data, analyze it in real-time, and ensure data-driven decision-making across departments like finance, marketing, and operations.
Qualitative Financial Data
Qualitative financial data is non-numerical but provides context to the numbers. It involves subjective information that helps businesses understand market trends, customer behavior, and operational challenges. They include:
- Market Sentiment
- Customer Feedback
- Brand Strength
- Employee Performance
How to Use Qualitative Data to Forecast Financial Success and Risks:
Non-numerical data can help businesses understand underlying factors that affect their financial performance, such as:
- Market sentiment can indicate economic conditions or investor confidence, directly impacting stock prices.
- Customer feedback reveals trends that might signal upcoming demand or potential risks.
- Employee performance provides insights into organizational efficiency, which directly affects profitability and operational success.
When combined with quantitative data, qualitative insights can help businesses forecast financial success and identify risks more effectively.
Historical vs. Real-time Financial Data
- Historical Data refers to past financial performance data, typically used for trend analysis, forecasting, and understanding long-term patterns. It helps in evaluating how the business has been performing over a specific period.
- Real-time Data provides up-to-the-minute insights into financial performance, enabling businesses to make immediate decisions. Real-time data is crucial for managing day-to-day operations, adjusting strategies, and addressing issues as they arise.
The Value of Real-Time Financial Data for Immediate Decision-Making and Operational Control:
Real-time data allows businesses to:
- Make timely decisions that respond to market shifts or operational changes.
- Monitor cash flow in real-time, ensuring businesses stay agile and avoid liquidity issues.
- Control inventory and operations, optimizing efficiency and reducing costs by identifying discrepancies quickly.
With INSIA’s platform, businesses can harness real-time financial data to take immediate actions, drive operational efficiency, and maintain financial stability.
Structured vs. Unstructured Financial Data
Structured Data is highly organized, often found in relational databases, spreadsheets, or financial systems. It’s easy to process and analyze using traditional methods.
- Examples: Balance Sheets, Profit and Loss Statements, Cash Flow Reports.
Unstructured Data on the other hand, is data that is not organized in a predefined manner. It can include text-heavy documents, emails, or reports that don’t fit neatly into traditional databases.
- Examples: Emails, Meeting Notes, Invoices, Customer Feedback.
How Unstructured Data Can Be Harnessed for Financial Analysis with the Right Tools:
Despite being harder to process, unstructured data holds valuable insights. With platforms like INSIA, businesses can:
- Extract insights from unstructured data using AI and NLP algorithms.
- Transform unstructured data into actionable reports, helping improve decision-making processes.
- Centralize data from both structured and unstructured sources for a unified view of financial performance.
As we move forward, let’s dive deeper into the Methods of Financial Data Analysis and explore how businesses can make the most of these data types.
Methods of Financial Data Analysis
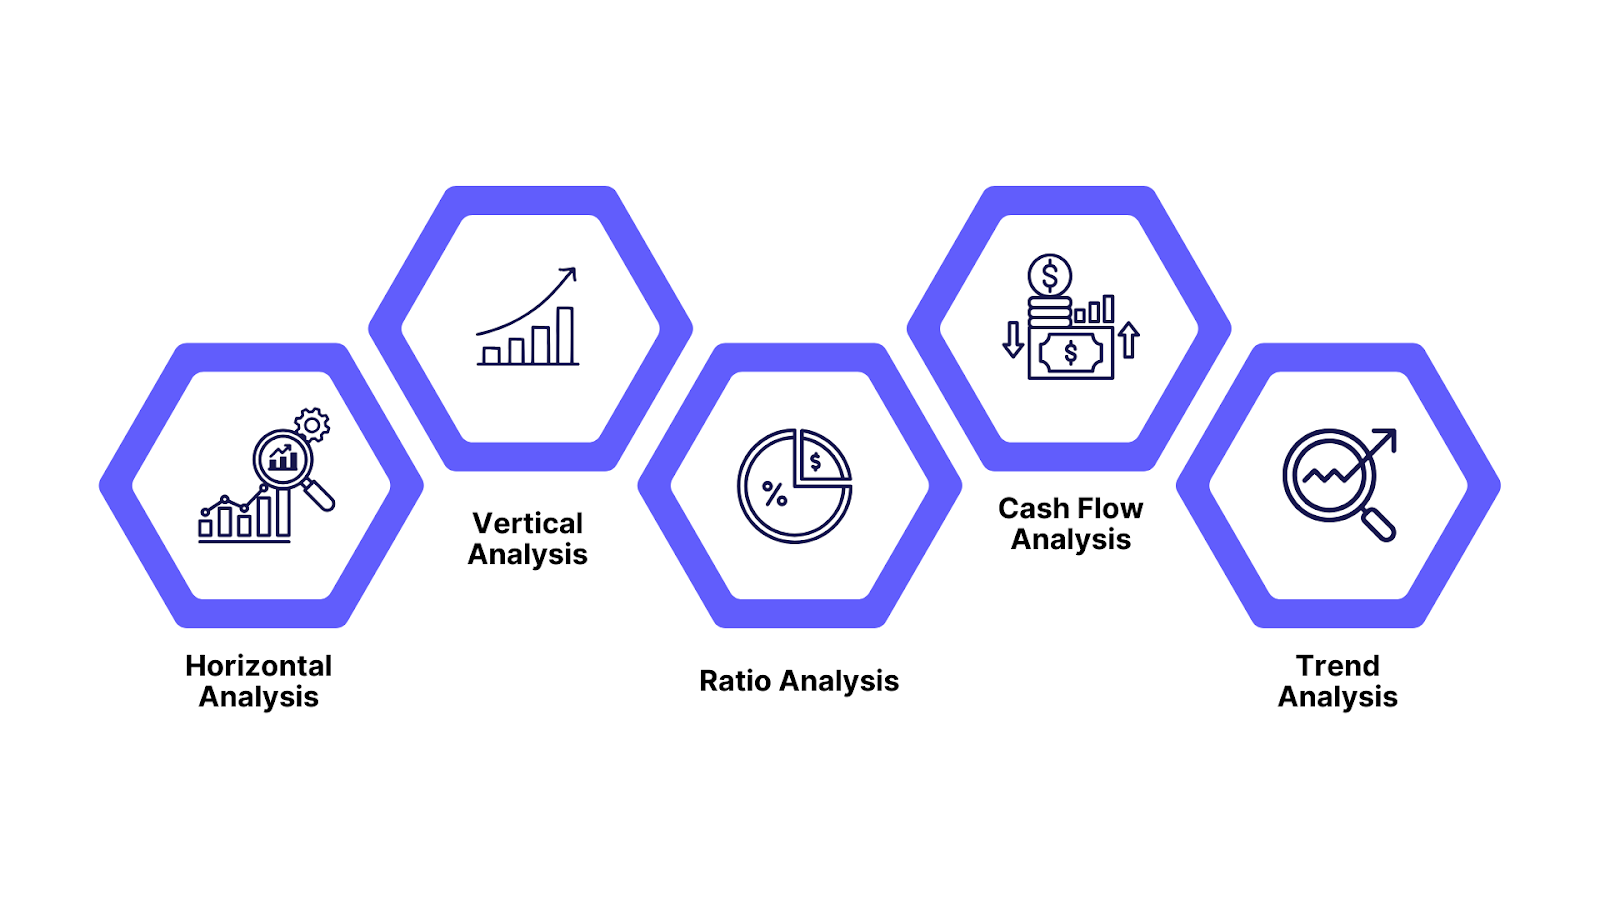
Financial data analysis is a crucial process for businesses to understand their financial performance, predict future trends, and make informed decisions. There are different methods of analyzing financial data, each offering unique insights. The types of financial analysis include:
1. Horizontal Analysis
Horizontal analysis compares financial data over multiple periods, allowing businesses to identify trends, growth patterns, or declines in performance over time.
- Benefits:
- Helps detect performance changes across periods.
- Reveals long-term trends and growth opportunities.
- Ideal for identifying patterns in revenue, expenses, and profit margins.
- Drawbacks:
- Requires accurate historical data, which may be difficult to obtain for older periods.
- Doesn’t account for external market changes or seasonal fluctuations.
How INSIA Helps: INSIA automatically centralizes and updates financial data, making historical analysis seamless. The platform’s real-time data ensures that comparisons are consistently accurate and up-to-date.
2. Vertical Analysis
Vertical analysis presents each item in the financial statements as a percentage of a base figure, providing insight into how individual components (like expenses or revenues) contribute to the overall financial picture.
- Benefits:
- Simplifies complex data by presenting ratios and percentages.
- Ideal for comparing financial statements across different companies or industries.
- Highlights potential areas for cost control or investment.
- Drawbacks:
- May not reveal the full picture if a company operates in multiple sectors or has diversified revenue streams.
- Relies on a stable base for accurate comparisons, which might not always be the case.
How INSIA Helps: INSIA offers customizable dashboards and visualization tools, helping businesses present financial statements in an easy-to-understand format. The platform allows real-time updates, ensuring accurate comparisons across periods.
3. Ratio Analysis
Ratio analysis uses key metrics (such as liquidity, profitability, and solvency ratios) to assess a company's financial health and operational efficiency.
- Benefits:
- Provides in-depth insights into a company’s financial strength.
- Helps monitor financial performance with measurable benchmarks.
- Useful for both internal management and external stakeholders.
- Drawbacks:
- Ratios alone may not offer enough context; external factors must be considered.
- Can be misleading if ratios are taken out of context or are calculated incorrectly.
How INSIA Helps: INSIA’s AI-driven platform automates the calculation of key financial ratios and integrates real-time data from multiple sources. This ensures that businesses can make informed decisions based on up-to-date and accurate ratios.
4. Cash Flow Analysis
Cash flow analysis evaluates a company’s inflows and outflows, helping businesses understand liquidity, the ability to pay bills, and the capacity to reinvest.
- Benefits:
- Critical for assessing the company’s ability to meet its obligations.
- Helps in planning future investments and ensuring operational continuity.
- Identifies cash flow issues early, preventing liquidity problems.
- Drawbacks:
- Does not account for non-cash items or longer-term investments.
- Can be skewed if cash management strategies are not optimized.
How INSIA Helps: INSIA’s real-time financial data monitoring allows for continuous cash flow analysis, providing businesses with instant insights into their liquidity. The platform’s AI-driven tools help forecast cash flow, offering proactive solutions to improve cash management.
5. Trend Analysis
Trend analysis looks at specific financial metrics over time to project future outcomes, helping businesses forecast performance, demand, and financial needs.
- Benefits:
- Helps businesses predict future performance and plan accordingly.
- Identifies long-term growth or declining trends that can inform strategic decisions.
- Valuable for financial planning, budgeting, and forecasting.
- Drawbacks:
- Past trends might not always predict future performance, especially in volatile markets.
- Dependent on historical data, which may not always reflect changing business dynamics.
How INSIA Helps: INSIA uses predictive analytics powered by AI to enhance trend analysis. By continuously analyzing financial data in real time, businesses can receive data-backed predictions and adapt strategies faster than ever before.
Now, let’s explore the essential tools and techniques used in financial data analysis to enhance these methods and drive effective decision-making.
Tools and Techniques Used in Financial Data Analysis
Financial data analysis involves various tools and techniques that help organizations interpret data, spot trends, and develop strategies. Below are the key tools and techniques that are widely used for this analysis.
Statistical Methods and Software
Statistical methods like regression, correlation, and hypothesis testing are fundamental to understanding financial trends.
- Regression: Used to predict the relationship between variables, such as predicting revenue based on marketing spend.
- Correlation: Helps measure the relationship between two financial variables (e.g., sales and expenses).
- Hypothesis Testing: Used to test assumptions or hypotheses regarding financial data, such as whether new investments are yielding returns.
Popular Software Tools for Financial Analysis
- Excel: One of the most commonly used tools for basic financial analysis and modeling.
- SPSS: A statistical software tool widely used for complex data analysis in finance.
- Python: A versatile tool for advanced financial analysis, including automation, machine learning, and predictive modeling.
Machine Learning and AI Techniques
Machine learning techniques are increasingly used in financial data analysis to predict trends, detect anomalies, and improve accuracy. These models leverage past financial data to forecast future outcomes.
Examples:
- Financial Forecasting: Predicting future financial performance, such as future revenues and profits.
- Anomaly Detection: Identifying outliers or unusual financial transactions that may indicate errors or fraud.
How INSIA Integrates AI
INSIA’s AI-driven platform automates financial data processing and predictive modeling. By leveraging historical financial data, it helps businesses forecast future trends with high accuracy. For instance, INSIA’s predictive capabilities helped Kirloskar Oil Engines reduce reporting time by 70% and improve decision-making agility.
Also read: Importance and Characteristics of Data Quality in Data Analytics
Data Visualization Tools
Visualization tools are essential for making financial data comprehensible. They help transform complex datasets into easy-to-understand charts and graphs, facilitating quicker decision-making.
Examples of Tools:
- Tableau: A powerful data visualization tool widely used for interactive dashboards.
- Power BI: A Microsoft tool that helps create customized reports and dashboards.
- INSIA’s Dashboarding: INSIA’s no-code platform offers a powerful dashboarding tool that allows businesses to generate real-time financial insights without requiring technical skills.
How Visualizations Help
By turning raw data into visual formats, these tools enable financial decision-makers to interpret data quickly. For example, real-time financial dashboards can help executives instantly view the company's performance and make timely adjustments.
Also read: Top SDR Dashboard Examples to Boost Sales
Financial Modeling and Simulation Tools
Financial models are crucial for forecasting business performance and managing risks. These models simulate financial scenarios and offer projections based on varying inputs.
Examples:
- Forecasting Models: Predict future revenue, expenses, or cash flow.
- Budgeting Models: Help businesses plan and allocate resources efficiently.
- Scenario Analysis: Simulates different business outcomes based on varying assumptions (e.g., changing market conditions).
How INSIA Simplifies Financial Forecasting
INSIA’s data modeling capabilities streamline the financial forecasting process, making it easier to forecast cash flow and evaluate financial outcomes. With its no-code interface, even non-technical users can create and adjust financial models, improving accuracy and decision-making efficiency.
Now that we’ve gone over the tools and techniques, let’s get into examples of financial data analysis and understand how businesses apply these methods to achieve actionable insights.
Examples of Financial Data Analysis
By analyzing key financial metrics and trends, companies can optimize performance, manage risks, and make strategic decisions. Here are some key examples of how financial data analysis drives decision-making and growth:
Risk Assessment and Management
Financial data analysis plays a pivotal role in risk management by helping businesses evaluate potential risks and develop proactive measures to mitigate them. Through predictive analytics, companies can forecast market volatility, operational disruptions, and financial risks.
Example: Businesses use financial analysis to assess market risks or operational disruptions. Predictive analytics enables early identification of potential financial threats.
Investment Analysis
Financial data analysis is essential for making informed investment decisions. By analyzing both historical and real-time data, businesses can evaluate the performance of their portfolios and make data-backed decisions.
Example: Portfolio performance analysis helps businesses understand how their investments are performing over time, enabling more strategic adjustments. Real-time data integration with tools like INSIA's predictive models improves accuracy.
Financial Statement Analysis
Analyzing key financial statements such as the balance sheet, income statement, and cash flow is fundamental to understanding a company’s financial health. This analysis guides decision-making on investments, operations, and strategic goals.
Example: Businesses examine these statements to assess financial performance, spot trends, and make informed, strategic decisions based on comprehensive financial insights.
Portfolio Management
Financial data analysis is crucial for optimizing investment portfolios and managing assets. With accurate data analysis, businesses can track returns and adjust their portfolios to maximize performance.
Example: Using INSIA’s analytics, businesses optimize their investment portfolios by analyzing financial data in real-time, helping to adjust strategies and improve returns.
Moving ahead, let’s explore how INSIA's advanced solutions help overcome the challenges of financial data analysis and unlock even greater insights.
Overcoming Challenges in Financial Data Analysis with INSIA's Solutions
Data Quality and Integrity Issues
Inconsistent data, errors, and discrepancies in financial records can distort insights and decision-making.
- Impact of this on Financial Analysis
Inaccurate or fragmented financial data can lead to poor business decisions. The presence of errors in income statements, balance sheets, and cash flow analysis can lead to misguided strategies.
- INSIA’s Role in Ensuring Data Accuracy
INSIA centralizes all financial data and performs data cleansing, ensuring that only accurate and consistent data is used in financial analysis. By integrating data from various sources into one unified platform, businesses can rely on real-time, precise financial information.
- INSIA’s Client Success Stories: Crescent Foundry
INSIA helped Crescent Foundry reduce reporting costs by 40% and improved time-to-insights by 50% through accurate, centralized data. The platform’s data cleansing capabilities ensured that all financial data was aligned and ready for strategic decision-making.
Handling Large Volumes of Data
As companies grow, managing and processing vast amounts of data becomes increasingly difficult, especially when insights need to be real-time.
- Challenges of Managing Vast Financial Data
As businesses scale, they often struggle with the volume and complexity of data, leading to slow reporting cycles and delayed decision-making.
- INSIA’s Role in Efficient Data Management
INSIA’s no-code platform simplifies handling large datasets by automating data processing and providing real-time insights. Businesses can quickly analyze vast amounts of data without the need for complex coding or extensive IT resources.
- INSIA Case Example: Trident Services
INSIA automated 90% of Trident Services’ reporting processes, reducing report generation time by 70%. This enhanced efficiency allowed for faster decision-making and better resource allocation.
Privacy and Security Concerns
Financial data is highly sensitive, and ensuring secure access while adhering to regulations (GDPR, HIPAA) is a top priority.
- Importance of Protecting Financial Data
Financial data breaches can have severe consequences, including financial losses and damage to a company’s reputation. Ensuring that data is secure and accessible only to authorized personnel is critical.
- INSIA’s Security and Compliance Features
INSIA provides robust security features such as role-based access control (RBAC), encryption, and automated backups. Additionally, the platform complies with industry standards like GDPR and HIPAA, ensuring that businesses meet regulatory requirements while keeping their data safe.
- INSIA Case Example: Alaric Enterprises
INSIA helped Alaric Enterprises streamline their financial operations while maintaining high levels of data security. By ensuring compliance with strict regulatory requirements, INSIA reduced manual effort by 50% and improved the efficiency of financial data management.
Evolving Technological Landscape
With AI, machine learning, and predictive analytics becoming the norm, businesses must adapt quickly to integrate advanced technologies into their financial workflows.
- Impact of AI and Predictive Analytics on Financial Analysis
AI and machine learning are revolutionizing financial analysis by enabling more accurate forecasting and real-time insights. These technologies help businesses make data-driven decisions with greater precision.
- INSIA’s Role in Adapting to Technological Advancements
INSIA integrates advanced AI-powered tools that enhance predictive analytics and automate decision-making processes. This allows businesses to stay ahead of the curve, responding quickly to changes in the market and their financial performance.
- INSIA Case Example: Kirloskar Oil Engines
INSIA’s AI-powered analytics helped Kirloskar Oil Engines reduce reporting time by 70%. By using predictive models, Kirloskar enhanced its decision-making process, improving responsiveness to market conditions and ensuring sustained business growth.
Conclusion
Throughout this blog, we've examined the vital role that financial data analysis plays in shaping strategic business decisions. From evaluating profitability and managing risks to improving operational efficiency, the power of financial insights cannot be overstated. However, despite the immense value financial data offers, many organizations struggle with the complexity of data integration, data accuracy, and time-consuming manual processes. This is where INSIA steps in.
INSIA’s no-code platform makes it easier than ever to centralize data, automate insights, and ensure real-time access to critical financial metrics. With its AI-powered capabilities, INSIA enhances decision-making accuracy, improves reporting efficiency, and allows businesses to adapt quickly to market changes. Whether you're looking to streamline financial analysis or improve operational control, INSIA helps businesses unlock the true potential of their financial data, driving smarter, faster decisions at scale.