Today every department, including sales, marketing, operations is awash in valuable data. Yet, for many teams, handling that data for decision-making still means waiting days (or weeks) for IT-generated reports.
This is where self-service analytics comes to the rescue.
Self-service analytics puts intuitive, no-code data tools directly into the hands of those who know the business best: non-technical business users, analysts, and frontline operations teams.
With these tools, anyone can connect to company data, build interactive dashboards, and uncover critical trends in real time.
The self-service analytics market is rapidly expanding and is projected to reach up to $26.54B by 2032. The number is a clear indication that self-service analytics is fundamentally changing how modern organizations operate and compete.
In this blog, we’ll explore how self-service analytics is bridging the gap between raw data and real-world business impact.
At a Glance
- Self-service analytics allows non-technical users to access, analyze, and visualize data independently, reducing reliance on IT.
- It offers real-time, customizable insights with intuitive, no-code tools, speeding up decision-making across departments.
- INSIA exemplifies this by providing no-code data integration, AI-powered data prep, and drag-and-drop dashboards for seamless analytics.
- While self-service analytics empowers business users, challenges like data silos and governance need to be managed for successful adoption.
What Is Self-Service Analytics?
Self-service analytics is a type of business intelligence (BI) that allows non-technical users, such as business professionals, analysts, and operational teams, to access, explore, and analyze data independently. This eliminates the need for deep technical skills or constant support from IT or data specialists.
It provides intuitive, often no-code or low-code tools that allow users to:
- Connect directly to internal data sources,
- Prepare and clean data,
- Create customized reports and interactive dashboards,
- Ask questions using natural language queries,
- Generate insights on-demand to make faster, data-driven decisions.
This approach democratizes data access across organizations, reducing bottlenecks caused by reliance on IT teams and accelerating time-to-insight.
It empowers everyday business users to explore data relevant to their roles and make informed decisions, helping foster a data-driven culture throughout the enterprise.
Who Uses Self-Service Analytics?
Self-service analytics is primarily used by a broad range of users within organizations who need to access, analyze, and interpret data independently without requiring technical expertise or constant support from IT or data scientists.
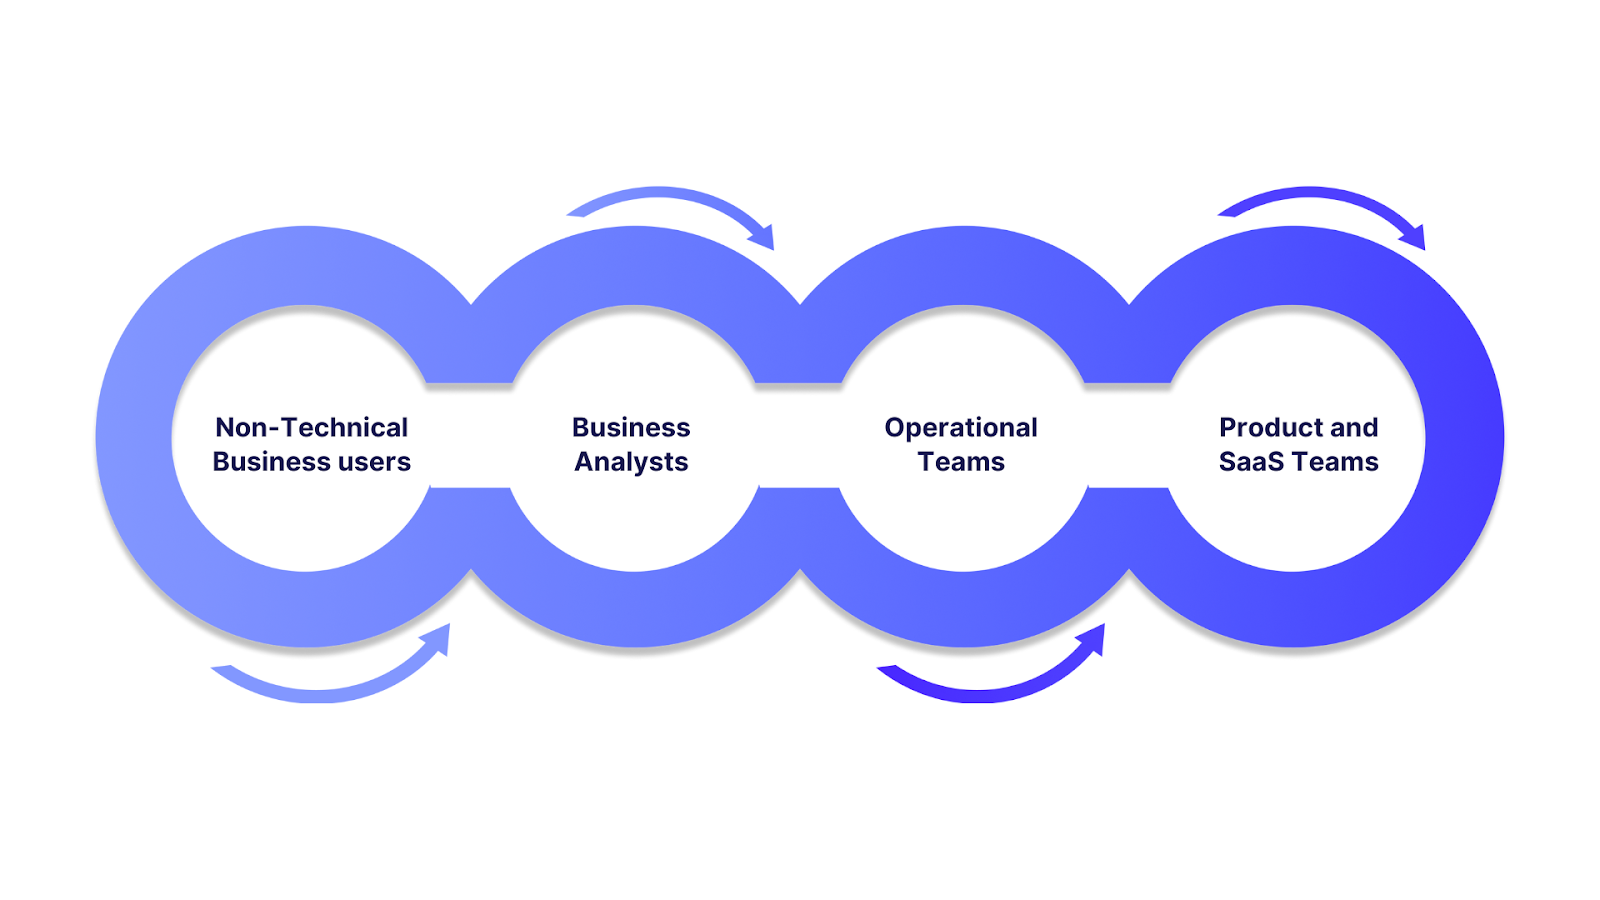
The main user groups are:
- Non-technical business users: These include professionals in departments like sales, marketing, procurement, and operations who benefit from easy access to real-time data and the ability to generate insights on their own.
- Business analysts: Analysts who can use self-service tools to quickly explore and visualize data without needing to write complex code or rely on IT.
- Operational teams: Frontline and management teams involved in day-to-day business processes use self-service analytics to monitor KPIs, spot trends, and make informed tactical decisions promptly.
- Product and SaaS teams: Self-service analytics allows product managers and development teams to analyze user behavior, track feature adoption, and optimize product experiences without extensive data science support.
How Does Self-Service Analytics Differ From Traditional BI?
Self-Service Analytics differs from Traditional Business Intelligence (BI) in several key ways related to user roles, data access, speed, flexibility, and overall approach to data analysis:
| Aspect | Traditional BI | Self-Service Analytics |
|---|---|---|
| User Roles | IT pros & analysts run reports; business users wait their turn | Empowers business users, analysts & ops teams to explore data independently |
| Data Access & Prep | Data prepped & controlled by IT; users get static reports | Users directly access, prep, and analyze data via no-code drag-and-drop tools |
| Speed & Agility | Slow: dependent on IT turnaround | Fast: on-demand dashboards & reports created by users |
| Flexibility | Rigid, static, IT-defined reports | Highly flexible, customizable, with ad hoc and natural language queries |
| Technical Skills | High: SQL, coding, BI expertise needed | Low: intuitive, no/low-code interfaces for everyone |
| Governance & Control | Centralized, strict IT-managed governance | Balanced governance—empowers users while maintaining data quality |
| Cost & Scalability | Expensive, resource-heavy, limited scalability | More cost-effective & scalable with wider user adoption |
Also Read: Big Data Analytics in Financial Services Industry
What Are The Key Features Of Self-Service Analytics?
Key features of self-service analytics platforms enable non-technical users and business teams to independently access, analyze, and act on data efficiently. These core capabilities include:
- User-Friendly Interface: Intuitive, clean design with drag-and-drop tools that let users build reports and dashboards without needing coding skills.
- Direct Data Access & Integration: Seamless connection to diverse data sources (databases, cloud apps, spreadsheets) without IT bottlenecks.
- Automated Data Preparation: Built-in AI or automation cleans and formats data, reducing manual effort and errors.
- Ad Hoc Analysis & Custom Dashboards: Users can explore data on demand, customize visualizations, and perform flexible queries including natural language search.
- Real-Time Data & Automated Insights: Access to up-to-date data and AI-driven highlighting of key trends for timely decisions.
- Collaboration & Sharing: Easy sharing and collaboration features that align teams through shared reports and dashboards.
- Governance & Security: Role-based access controls and data governance ensure data accuracy, compliance, and secure usage.
- Mobile Accessibility: Support for accessing analytics on mobile devices, enabling decisions anytime, anywhere.
- Scalability: Capable of growing with organizational needs, supporting multiple users and increasing data volumes.
INSIA exemplifies these capabilities by offering no-code data integration, AI-powered cleaning, natural language query, proactive insights, enterprise-grade governance, and mobile support. It makes self-service analytics truly accessible and effective for business users, analysts, and operations teams alike.
Benefits of Self-Service Analytics for Businesses
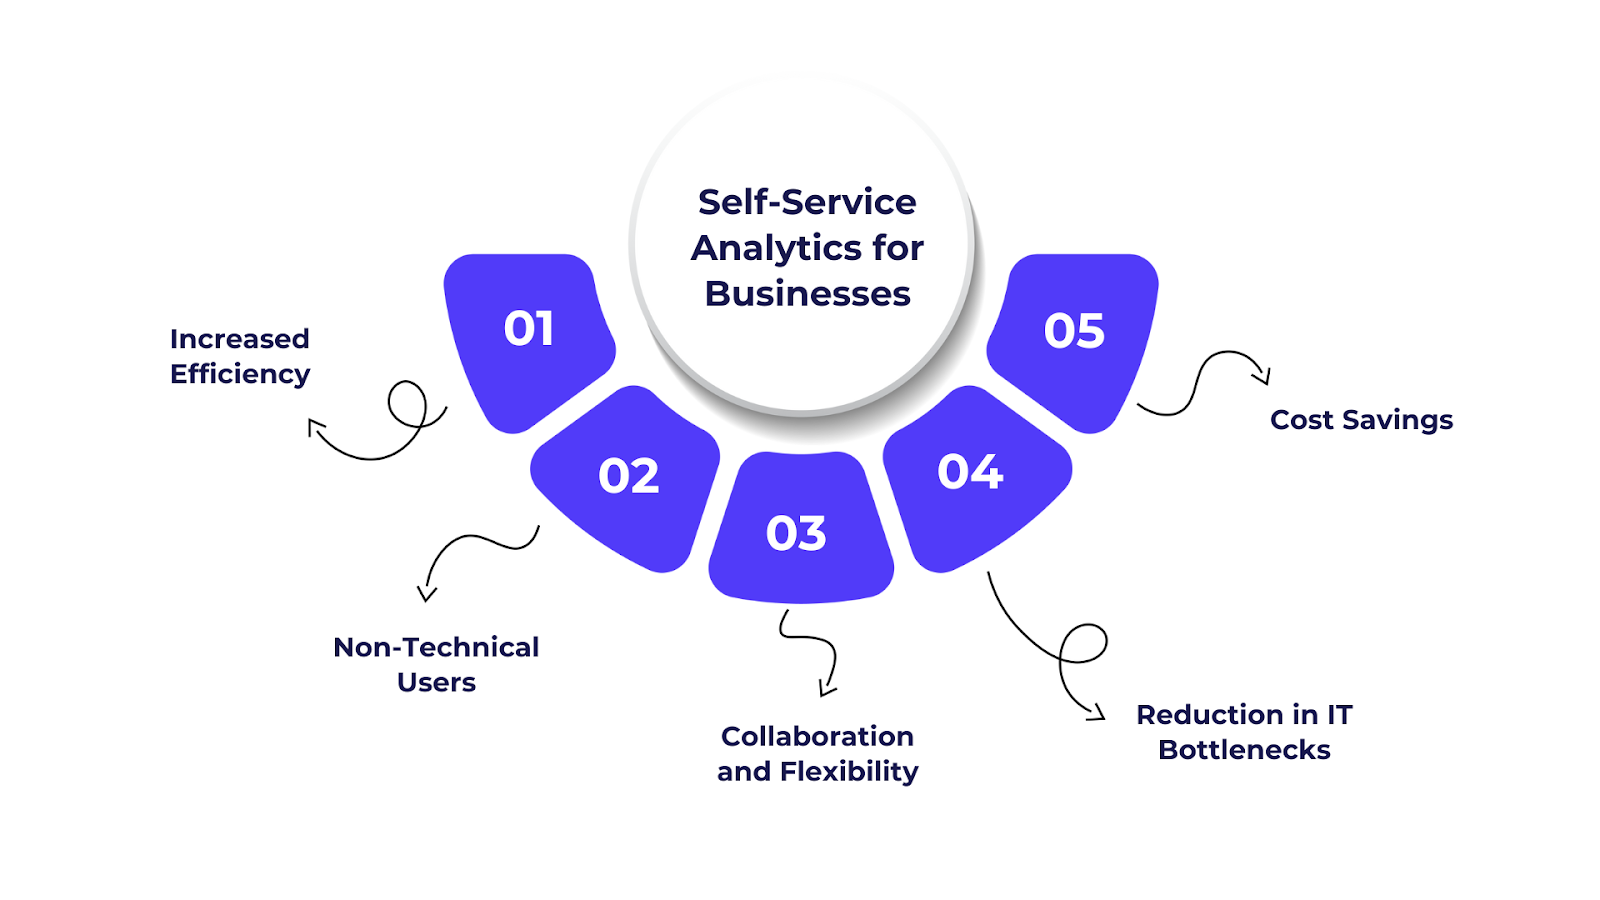
Self-service analytics empowers teams to access and explore data independently, accelerating insights and decision-making without relying on IT.
- Increased Efficiency and Speed: Real-time access to data and reports, improving decision-making speed and responsiveness.
- Empowering Non-Technical Users: No longer needing IT for every report request, business users can independently generate insights.
- Improved Collaboration and Flexibility: Sharing insights across departments, fostering collaboration, and improving business agility.
- Reduction in IT Bottlenecks: IT departments can focus on more strategic projects, as business users take over routine data analysis tasks.
- Cost Savings: Lower operational costs by reducing the need for external analytics support and minimizing reliance on technical experts.
Implementing self-service analytics can unlock fast, data-driven decision-making, but several core challenges can limit its impact if not addressed thoughtfully.
Key Challenges of Implementing Self-Service Analytics
Here’s a clear look at what organizations often face, why it matters, and practical ways to overcome each obstacle:
| Challenge | Impact |
|---|---|
| Data Silos | Fragmented data across departments makes it hard to get a unified, accurate, and reliable view, leading to incomplete or inconsistent insights. Users struggle to find and trust the right data. |
| Poor Data Quality | Inaccurate, inconsistent, or stale data can cause wrong analyses, loss of trust in insights, and poor decision-making across the organization. |
| Lack of Training & Data Literacy | Business users without adequate skills can misinterpret data, misuse tools, or underutilize analytics, resulting in low adoption and ineffective decisions. |
| Tool Complexity | Overly complex platforms overwhelm users, causing frustration, resistance, and reduced engagement with analytics. This limits the value of self-service. |
| Governance & Access Control | Without clear roles, permissions, and oversight, organizations risk data misuse, breaches, and inconsistencies that undermine data trust and compliance. |
Recognizing these challenges is the first step; effective solutions come from applying best practices thoughtfully tailored to overcome each obstacle.
Best Practices for Implementing Self-Service Analytics
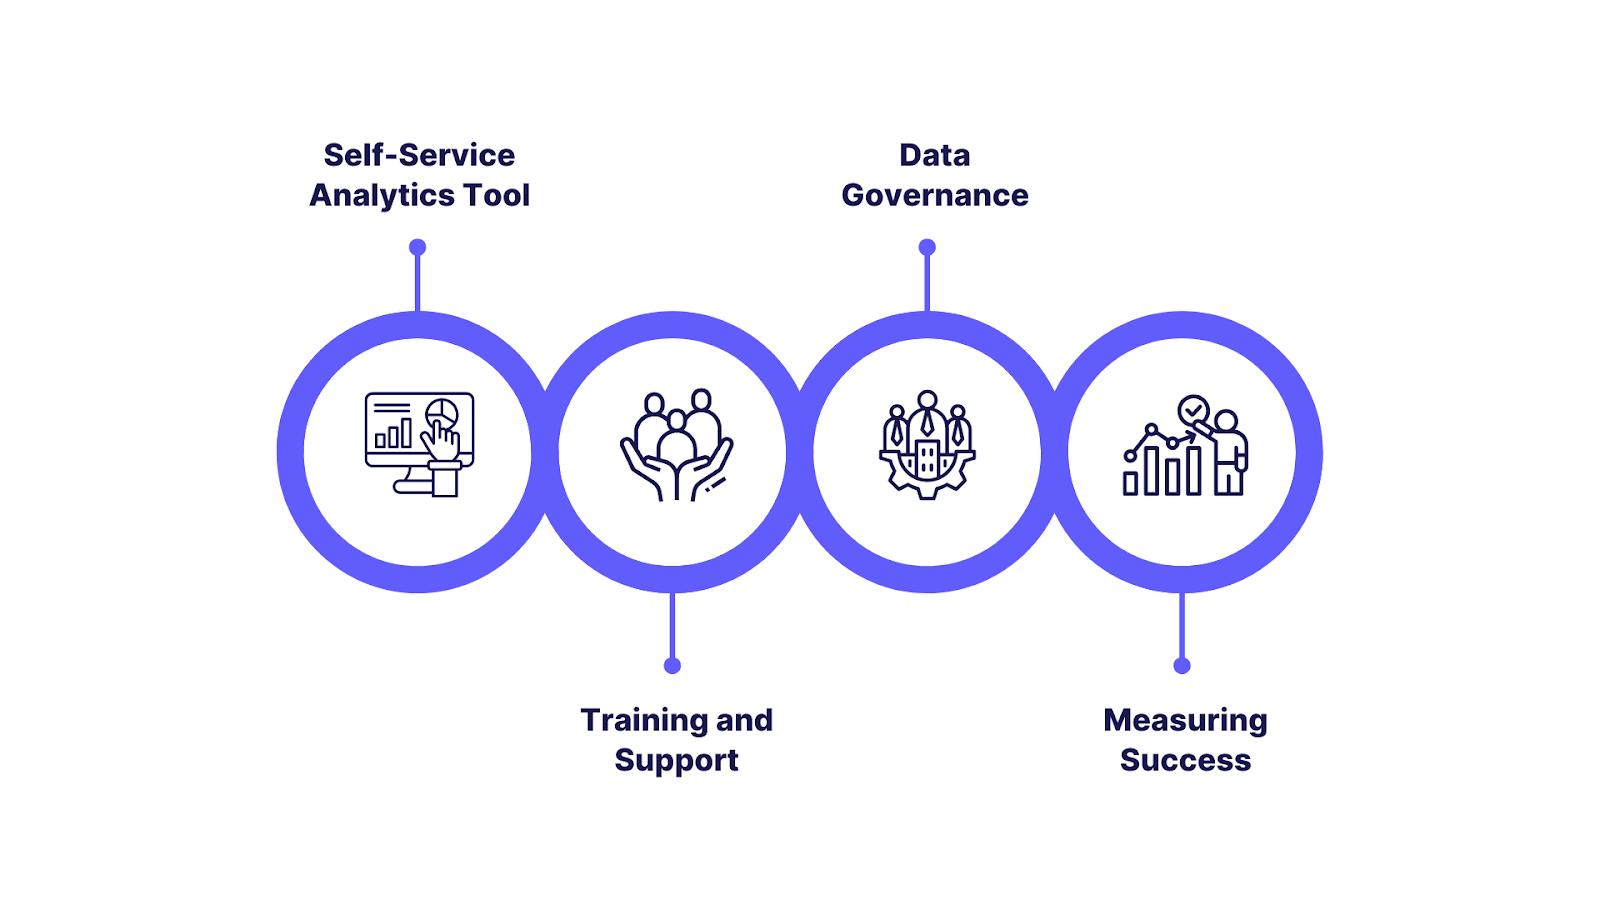
Implementing self-service analytics successfully demands strategic alignment, user empowerment, and strong governance. Below are key best practices organized by your focus areas:
1. Selecting the Right Self-Service Analytics Tool
- Choose platforms that prioritize usability with intuitive, no/low-code interfaces suitable for non-technical users.
- Ensure strong security features like role-based access control and data encryption.
- Confirm broad integration capabilities with your existing data sources and IT ecosystem.
- Prioritize solutions that scale easily as your user base and data volumes grow.
- Look for AI-powered automation capabilities (e.g., data cleaning, natural language queries) to speed insights and reduce manual effort.
2. Training and Support
- Conduct tailored, role-based training programs to build users' skills and boost data literacy.
- Provide ready-to-use templates and self-help resources to accelerate adoption.
- Establish a feedback loop to continuously refine training content and address user challenges.
3. Ensuring Data Governance
- Define and enforce clear data standards, including quality, consistency, and labeling.
- Implement access controls that balance user freedom with security and compliance.
- Use monitoring tools to track usage patterns and detect anomalies or misuse.
- Foster collaboration between IT, data teams, and business users to maintain data integrity.
4. Measuring Success
- Track KPIs like:
- Reduction in time to insight (speed of generating reports and decisions)
- Decrease in IT support tickets related to analytics requests
- User satisfaction and adoption rates
- Business impact metrics such as improved decision quality and operational efficiency
Use these metrics to continuously optimize platform features, training, and governance. Next, let’s see how organizations across different sectors are putting these principles into action.
Also Read: Financial KPIs and Metrics for Tracking Success
Industry-Specific Use Cases of Self-Service Analytics
This table highlights how diverse industries use self-service analytics to empower key user groups with faster, more agile data-driven decision-making:
| Industry | User Group | Use Case | Benefits |
|---|---|---|---|
| Manufacturing | Plant-level teams | Track downtime and diagnose issues | Reduced stoppages, increased productivity |
| Retail | Store managers | Monitor sales and inventory trends | Agile decisions, optimized revenues |
| Healthcare | Admin staff | Access and analyze claims data | Faster processing, improved autonomy |
| Finance | Revenue teams | Create forecasts and scenario analysis | Faster budgeting, improved accuracy and speed |
To fully unlock the value of these industry use cases, organizations need a powerful, user-friendly platform like INSIA that simplifies data access and drives smart, timely decisions without IT delays.
Also Read: How to Perform Basic Cash Flow Analysis
INSIA: Enabling Self-Service Analytics for Modern Businesses
INSIA is a next-generation analytics and business intelligence platform specifically built to empower users, regardless of technical skill level to tackle self-service analytics.
INSIA offers an intuitive, no-code interface that enables professionals to independently connect to diverse data sources, cleanse and prepare their data, and visually explore insights using AI-driven tools. It has applications across sales, marketing, procurement, and production.
How INSIA Delivers Self-Service Analytics:
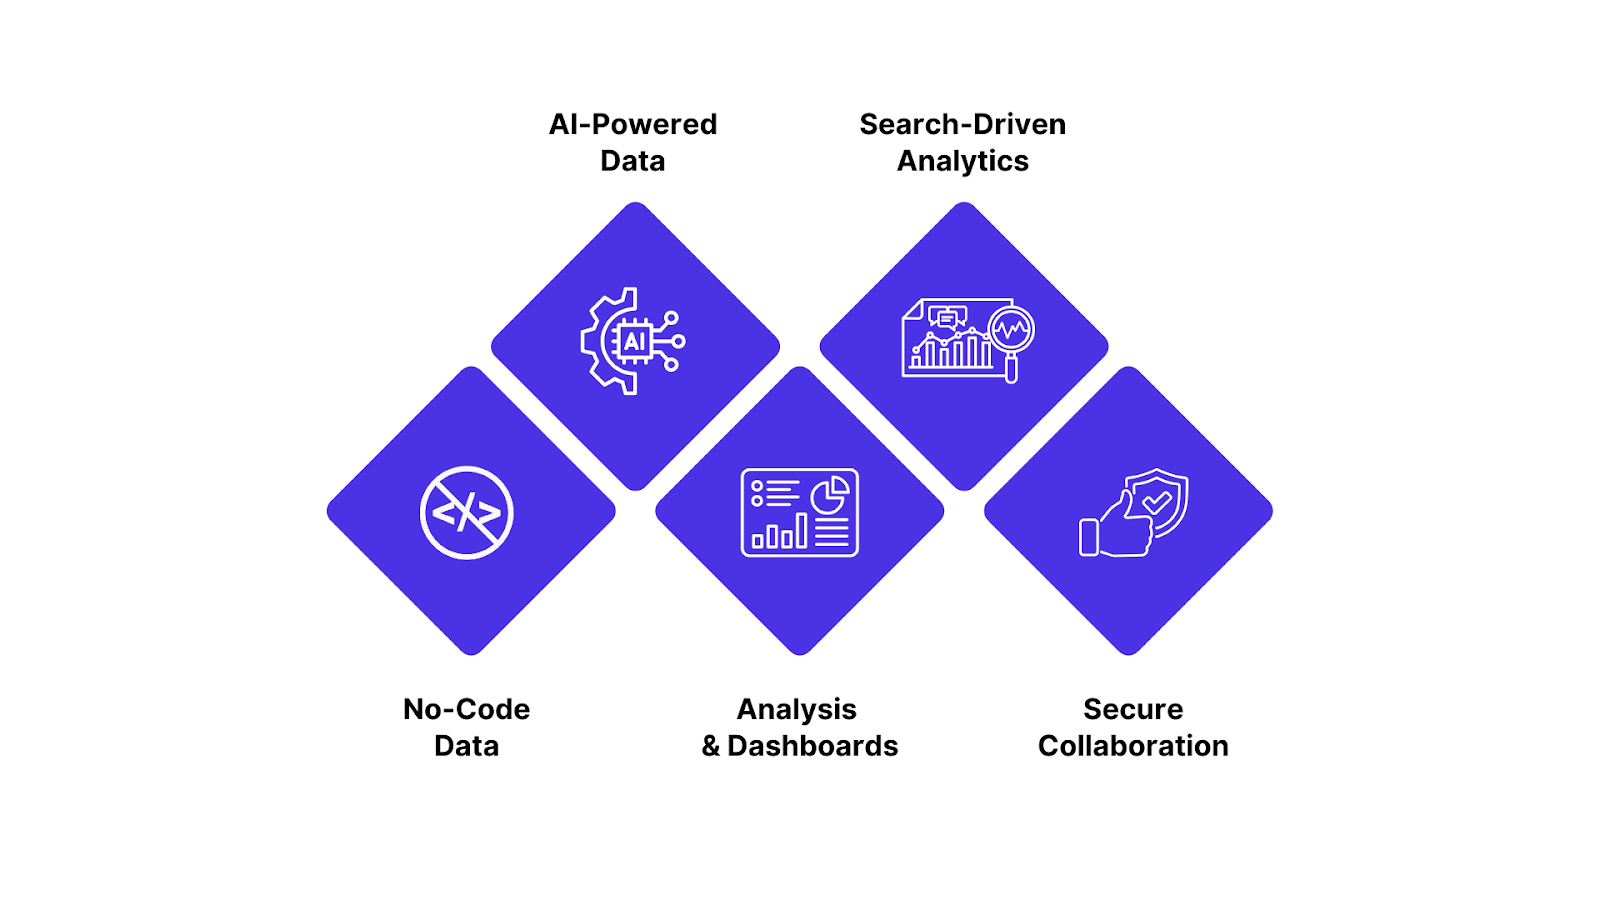
- No-Code Data Integration: Users can unify data from over 30 data sources, including spreadsheets, databases, cloud apps, and third-party business tools without writing a single line of code. This minimizes IT bottlenecks and speeds up the analytics process.
- AI-Powered Data Preparation: One-click routines automatically clean, format, and validate data, removing traditional obstacles for non-technical users.
- Drag-and-Drop Analysis & Dashboards: INSIA provides interactive dashboards and powerful reporting tools which can be customized easily, giving users instant answers to business questions and the flexibility to dig deeper as needed.
- Search-Driven Analytics: Natural language queries and AI suggestions allow users to explore and visualize their data conversationally, much like searching on the web.
- Secure Collaboration: Built-in security, governance, and mobile access ensure that insights can be safely accessed by teams and decision-makers wherever they are.
Why This Matters
By lowering the barriers to advanced analytics, INSIA enables organizations to democratize data access. Teams gain the freedom to experiment, iterate, and find new opportunities, without waiting for specialized analytics support.
This accelerates decision-making, encourages productivity, and helps companies get more value from their data investments.
INSIA exemplifies the promise of self-service analytics: putting the power of advanced BI directly into the hands of those who need it most throughout the organization.
Real-World Impact: Trident Diesel Systems Transforms with INSIA
An outstanding example of self-service analytics in action comes from Trident Diesel Systems, whose manual, spreadsheet-driven reporting hindered efficient decision-making and responsiveness. By implementing INSIA, Trident:
- Integrated data from Salesforce, field service apps, and OEM systems into a single platform.
- Equipped business users, not just data specialists with drag-and-drop dashboarding and guided search analytics.
- Automated data prep and report generation, saving over 45 hours per month and slashing leadership meeting times by 75%.
- Empowered non-technical staff to interpret data and drive operational improvements on their own.
The result: Greater agility, smarter resource allocation, and a culture where timely, data-driven decisions are the norm, not the exception.
Conclusion
Self-service analytics represents more than just a technological shift, it marks a transformation in how organizations engage with data, turning curiosity into insight and insights into action.
By empowering individuals at every level to explore and interpret data on their own terms, businesses unlock a wellspring of innovation and responsiveness previously constrained by traditional barriers.
Platforms like INSIA are catalysts in this transformation, blending intuitive design with intelligent automation to break down complexity while upholding governance. They reshape the relationship between teams and information, building a culture where experimentation and informed decision-making thrive hand in hand.