TL;DR
- Financial KPIs help businesses assess performance, profitability, and operational efficiency, guiding decision-making and strategic growth.
- Key metrics include Net Profit Margin, ROI, Gross Profit Margin, Current Ratio, and more.
- KPIs vs. Metrics: KPIs track core business goals, while metrics provide granular performance data.
- Strategic Role: KPIs align with long-term goals such as market positioning, profitability, efficiency, and sustainability.
- Categories of Financial KPIs: Revenue & Profitability, Liquidity, Efficiency, Investment, and Risk Management metrics.
- INSIA's Role: Real-time data tracking, customizable dashboards, and AI-driven insights to streamline KPI management and boost decision-making.
Adaptation: Continuously monitor and adjust KPIs as business conditions change to ensure alignment with evolving strategies.
A recent McKinsey survey reveals that 78% of organizations now utilize AI in at least one business function, underscoring the growing reliance on data-driven decision-making across industries . In this data-centric era, financial KPIs (Key Performance Indicators) have become indispensable tools for businesses aiming to assess their financial health, drive growth, and mitigate risks.
However, many organizations still grapple with fragmented data sources, manual reporting processes, and delayed insights. These challenges can hinder timely decision-making and strategic planning. This is where INSIA steps in.
INSIA is a modern, no-code data platform designed to streamline the management and analysis of financial KPIs. By centralizing data, automating reporting, and providing real-time insights, INSIA empowers businesses to make informed decisions swiftly and efficiently.
In this article, we will explore the significance of financial KPIs, delve into key metrics that drive business success, and demonstrate how INSIA can enhance your organization's financial performance through seamless data integration and advanced analytics.
What Are Financial KPIs and Why Do They Matter?
Financial KPIs (Key Performance Indicators) are essential metrics that businesses use to gauge their financial health, success, and efficiency. These indicators not only reflect a company’s current financial situation but also provide the measurable data and insights necessary for strategic decision-making and long-term growth.
By tracking financial KPIs, organizations can ensure they remain competitive and responsive to the ever-changing market dynamics.
Some key financial KPIs include:
- Net Profit Margin: Measures the percentage of revenue remaining after all expenses.
- Return on Investment (ROI): Evaluates the return gained from investments.
- Current Ratio: Assesses a company’s ability to pay off its short-term liabilities with its short-term assets.
- Gross Profit Margin: Indicates how well a company is producing revenue relative to its costs.
KPIs vs. Metrics: Understanding the Key Differences
While financial KPIs and metrics are often used interchangeably, there are key differences that set them apart.
- KPIs are high-level indicators that directly tie into the core business objectives, providing an overview of performance towards achieving long-term goals.
- Metrics, on the other hand, are more granular data points that measure specific aspects of performance, often supporting the broader KPIs.
Why Tracking Financial KPIs Matters:
Here are the reasons why tracking these indicators is important.
- Comprehensive Business Insights: Financial KPIs offer a detailed overview of a company's financial health and help in identifying areas that require attention.
- Strategic Decision-Making: By monitoring these KPIs, decision-makers gain the insights necessary to make informed decisions on budgeting, investment, and resource allocation.
Financial KPIs give companies the data they need to improve their strategies and optimize financial performance. This helps align the goals of various departments and teams with the broader organizational vision.
The Strategic Role of Financial KPIs
By evaluating these Financial KPIs, companies can quickly identify strengths, weaknesses, and potential areas for improvement. These key indicators offer an objective way to assess current performance against both short-term targets and long-term strategies, making them invaluable for decision-makers in any organization.
How Financial KPIs Provide a Clear Picture of Company Performance
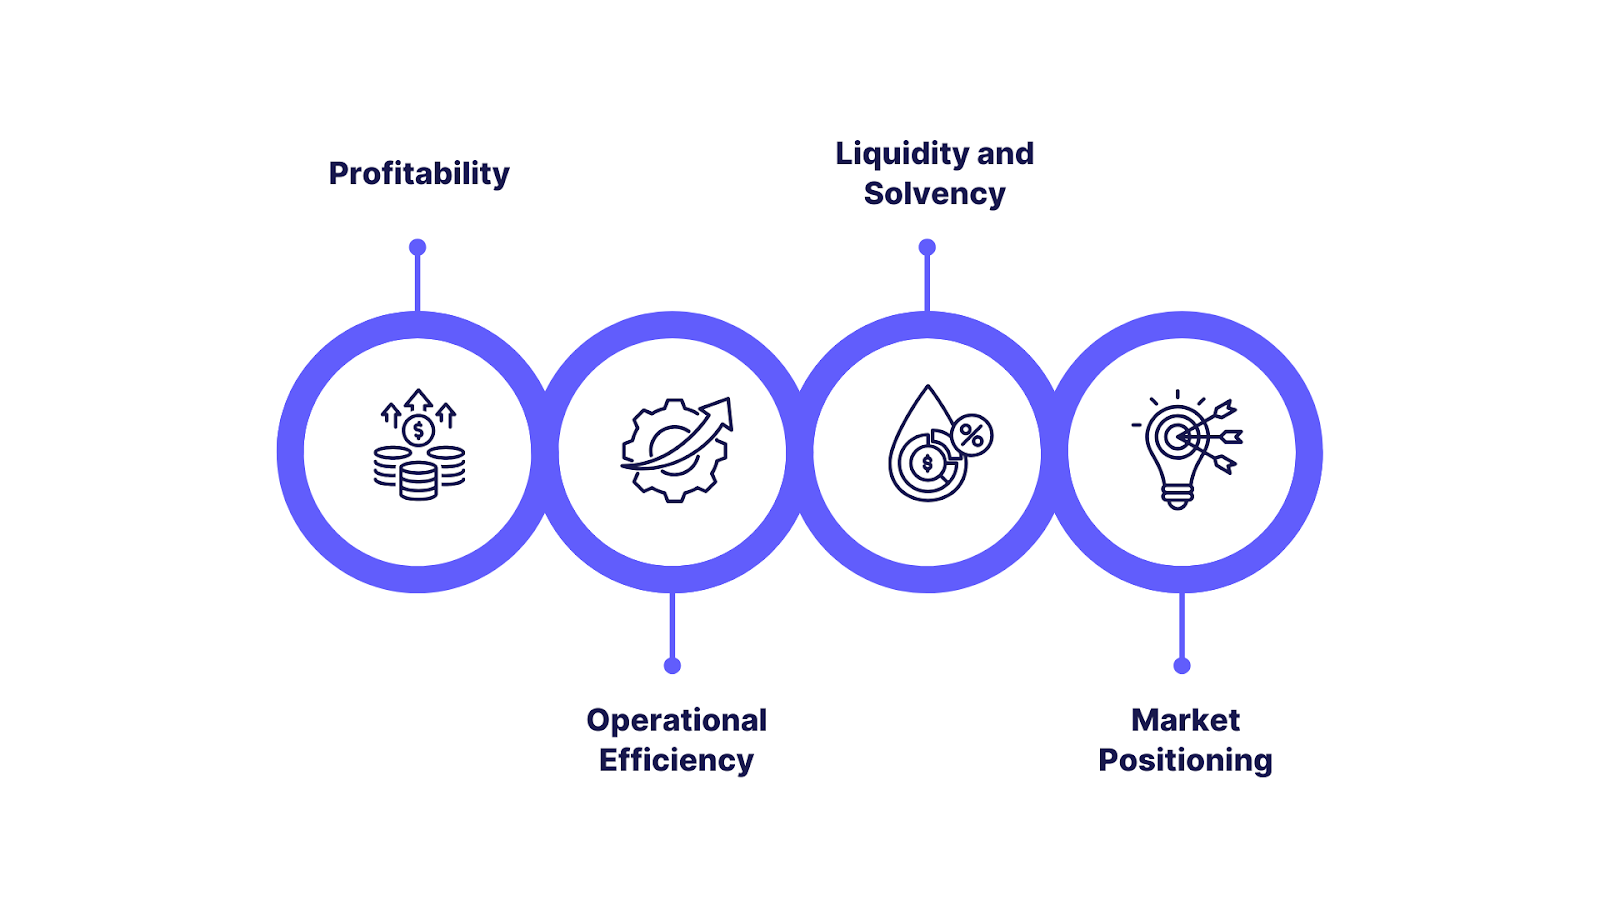
Tracking financial KPIs helps businesses understand their current financial standing, monitor trends, and evaluate performance across various departments. Here’s how they provide clarity:
- Profitability: KPIs such as Net Profit Margin and Return on Investment (ROI) allow companies to measure profitability and gauge the effectiveness of their financial strategies.
- Operational Efficiency: KPIs like Operating Profit Margin and Cash Flow help assess how effectively resources are being utilized to generate profit, highlighting operational inefficiencies.
- Liquidity and Solvency: Metrics such as the Current Ratio or Quick Ratio provide a view of a company’s ability to meet its short-term liabilities and assess its financial health.
- Market Positioning: KPIs like Market Share and Revenue Growth offer insight into the company’s competitive standing, guiding decisions on pricing, product development, and market expansion.
The Relationship Between KPIs and Long-Term Goals
Financial KPIs aren’t just metrics for immediate performance, they’re critical to achieving long-term success. The alignment between KPIs and long-term business goals creates a roadmap for sustainable growth. Here’s how KPIs contribute to this:
With a clear understanding of the strategic role that financial KPIs play, it’s time to dive deeper into the Key Categories of Financial KPIs that offer comprehensive insights into various facets of business performance.
Key Categories of Financial KPIs
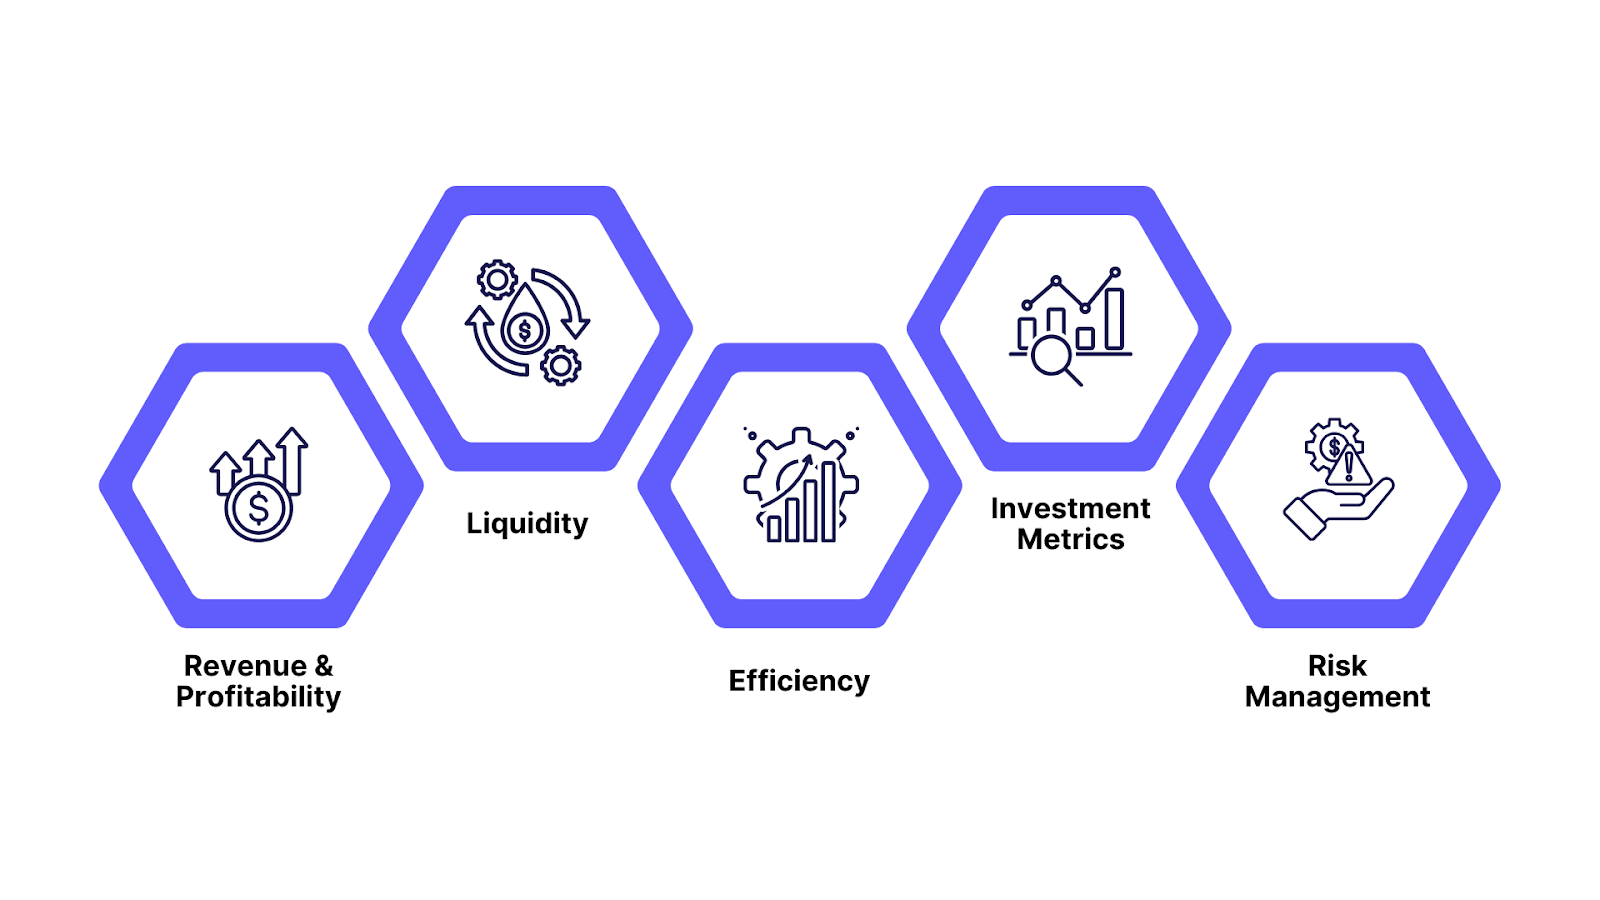
Financial KPIs are essential for measuring and tracking an organization's financial health and performance. These KPIs are segmented into various categories to provide a more comprehensive view, allowing businesses to evaluate their success from different perspectives. Here are the key categories of financial KPIs:
- Revenue & Profitability Metrics: Measures revenue growth, profit margins, and overall financial success.
- Liquidity: Assesses a company’s ability to meet short-term obligations using metrics like the current ratio and quick ratio.
- Efficiency: Focuses on how well resources are being utilized to generate profits (e.g., asset turnover, inventory turnover).
- Investment Metrics: Evaluates how effectively the company is generating returns on investments (e.g., ROI, return on equity).
- Risk Management: Identifies and measures potential financial risks, such as market, credit, and operational risks.
By categorizing KPIs, businesses gain a well-rounded view of their financial performance, which supports data-driven decision-making and long-term success.
As we move forward, let’s take a deeper look into Revenue and Profitability Metrics to understand how these key figures shape financial strategies.
Revenue and Profitability Metrics
Revenue and profitability metrics are essential for assessing the financial health and success of a business. By tracking these metrics, organizations gain insights into their overall market position and operational efficiency. Here are the key components of these metrics:
- Net Profit Margin: The percentage of revenue remaining after all expenses (including taxes and interest) have been deducted from total revenue.
Importance: Indicates the company’s ability to convert revenue into actual profit. A high net profit margin signals sustainable growth and operational efficiency. - Gross Profit Margin: The percentage of revenue remaining after deducting the cost of goods sold (COGS), but before accounting for operating expenses.
Importance: Provides insight into the basic efficiency of production or service delivery. It helps businesses determine pricing strategies and manage production costs effectively. - Operating Profit Margin: The percentage of revenue remaining after deducting direct operational costs, but before interest and taxes.
Importance: Shows the company’s ability to generate profit from its core operations. It’s a key indicator of operational efficiency and the effectiveness of management.
- Earnings Before Interest and Taxes (EBIT): A measure of a company’s profitability that excludes interest and tax expenses, focusing on operational performance.
Importance: Assesses a company's core operational profitability, highlighting its performance without the impact of financing or tax-related factors.
- Return on Revenue (ROR): The percentage of revenue that is converted into profit after operational costs are deducted.
Importance: Reflects how effectively a business turns its revenue into profit. It’s essential for setting benchmarks and assessing the business’s ability to manage revenue generation.
INSIA’s unified data platform allows businesses to track multiple revenue streams in real-time, providing comprehensive insights into growth and profitability. With seamless integration across various data sources, INSIA empowers organizations to evaluate and analyze their financial performance with ease, ensuring that decision-makers have accurate, actionable insights.
Now that we’ve explored revenue and profitability metrics, let’s dive into Liquidity and Solvency Metrics, which are equally critical for assessing the financial health of your organization.
Liquidity and Solvency Metrics
Liquidity and solvency metrics are crucial for assessing a company’s financial health, especially its ability to meet short-term obligations and sustain long-term operations. These metrics provide insight into how well a business can manage market fluctuations and financial stress.
- Current Ratio: Measures a company's ability to cover its short-term liabilities with its short-term assets. It is calculated by dividing current assets by current liabilities.
Importance: A ratio of 2:1 is considered healthy, indicating that the company has double the assets compared to its liabilities. It reflects the company’s short-term financial stability and ability to meet obligations.
- Quick Ratio: Also known as the acid-test ratio, this measures a company’s ability to cover short-term obligations using its most liquid assets. It excludes inventory from assets, offering a more stringent measure of liquidity.
Importance: It provides a more conservative view of a company’s liquidity by focusing on assets that can be quickly converted to cash, excluding inventory which may not be as easily liquidated.
- Cash Ratio: The most conservative liquidity metric, evaluating the company’s ability to pay off current liabilities using only cash or cash equivalents.
Importance: It gives a very strict measure of liquidity. A high cash ratio indicates the company is in a strong position to meet its short-term obligations even during times of financial stress.
- Interest Coverage Ratio: Assesses a company’s ability to meet its interest obligations from operating profits. It is calculated by dividing EBIT (Earnings Before Interest and Taxes) by interest expenses.
Importance: A higher ratio indicates greater capacity to pay interest from operating profits. It reflects the company’s financial health and its ability to manage debt servicing. - Debt-to-Equity Ratio: Measures the balance between debt and equity financing. It is calculated by dividing total debt by shareholders' equity.
Importance: This ratio indicates the company’s long-term financial stability and risk. A higher ratio means the company relies more on debt to finance its operations, which could increase financial risk.
- Working Capital: The difference between a company’s current assets and current liabilities, indicating whether the company has enough short-term assets to cover its short-term liabilities.
Importance: Positive working capital ensures that the company can fund its day-to-day operations. It indicates that the company can comfortably cover its short-term debts without jeopardizing its financial stability.
INSIA helps businesses track these liquidity and solvency metrics in real-time, making financial decision-making more data-driven and efficient. By integrating data from various sources, INSIA provides businesses with accurate, up-to-date insights into their financial health, enabling timely decisions and enhanced financial planning.
Now that we’ve explored liquidity and solvency metrics, let’s shift focus to Efficiency and Operations Metrics, where we delve into how operational efficiency impacts profitability.
Choosing the Right Financial KPIs for Your Business Model
Choosing the right financial KPIs for your business model is crucial for effective financial management. By aligning KPIs with your unique business objectives and strategies, you can make informed decisions that drive growth and profitability. Financial KPIs must reflect your business's financial health, strategy, and goals.
Steps to Choose the Right Financial KPIs:
- Identify Business Goals: Define clear business objectives such as growth, profitability, or cost reduction.
- Understand Key Drivers: Determine what factors (e.g., revenue, expenses, liquidity) drive your business's performance.
- Select Relevant Metrics: Choose KPIs that align directly with your goals. For instance, if profitability is the goal, focus on metrics like net profit margin.
- Ensure Data Availability: Ensure the data needed to track these KPIs is accessible and reliable. Use platforms like INSIA for centralized data collection.
- Regular Monitoring & Adjustment: Review KPIs periodically and adjust them as business needs evolve or new insights emerge.
INSIA’s platform helps businesses identify and choose KPIs that are specifically aligned with their financial model. Through real-time analytics and customizable dashboards, businesses can focus on the metrics that matter most, ensuring that every financial decision is data-driven and strategically aligned.
With the right KPIs in place, let’s explore Efficiency and Operations Metrics, where we get into the operational aspects that drive business success.
Also Read: 13 Sales Dashboard Examples for Effective Setup
Efficiency and Operations Metrics
Efficiency and operations metrics are vital for measuring how well a company utilizes its resources to generate revenue and minimize costs. These KPIs help organizations optimize operations, streamline processes, and maximize profitability.
Key Metrics:
- Asset Turnover Ratio: Measures the efficiency of a company’s assets in generating revenue. It is calculated by dividing net sales by the average total assets.
Importance: A higher ratio indicates that the company is effectively using its assets to generate sales, demonstrating strong operational efficiency. The higher the ratio, the better the company is at turning its asset base into revenue. - Inventory Turnover Ratio: Shows how often a business sells and replaces its inventory over a period. It is calculated by dividing the cost of goods sold by the average inventory during a period.
Importance: A higher inventory turnover ratio suggests that the company efficiently manages its inventory. This helps reduce storage costs and avoid overstocking, which can tie up valuable working capital. - Days Sales Outstanding (DSO): Represents the average number of days it takes for a company to collect payment after a sale. It is calculated by dividing accounts receivable by net credit sales and multiplying by the number of days in the period.
Importance: A lower DSO means that a business is collecting payments more quickly, improving cash flow. Lower DSO helps the business reduce the need for external financing, strengthening its liquidity position. - Days Payable Outstanding (DPO): Measures how long it takes for a company to pay its suppliers. It is calculated by dividing accounts payable by the cost of goods sold and multiplying by the number of days in the period.
Importance: A balanced DPO helps businesses manage their liquidity effectively without damaging relationships with suppliers. Extending DPO strategically can improve cash flow, but excessively high DPO may lead to strained supplier relationships.
- Cash Conversion Cycle (CCC): Reflects the time it takes for a company to convert its investments in inventory and other resources into cash flows from sales. It is calculated as DSO + DIO (Days Inventory Outstanding) - DPO.
Importance: A shorter CCC indicates better liquidity and cash flow management. It suggests that the company is able to quickly turn its investments into cash, which can be reinvested to drive further growth. - Fixed Asset Turnover: Measures how efficiently a company uses its fixed assets to generate revenue. It is calculated by dividing net sales by net fixed assets.
Importance: A higher fixed asset turnover ratio indicates that the company is effectively using its physical assets, such as machinery, equipment, and property, to drive sales. This is particularly important for capital-intensive industries.
How Operational Efficiency Affects Profitability:
Improved operational efficiency lowers costs, accelerates processes, and directly contributes to higher profitability. By fine-tuning resource management, companies can significantly increase their competitiveness and overall profitability.
INSIA’s Role:
- Real-Time Data Synchronization: INSIA integrates various business systems (ERP, CRM, IoT) for seamless access to operational data, ensuring accurate, up-to-date insights on efficiency.
- Automated Reporting & Forecasting: INSIA’s predictive analytics helps optimize inventory, manage cash flow, and enhance operational decisions with minimal manual intervention.
Now that we've understood how efficiency and operations metrics can transform business performance, let’s explore the next vital category - Investment and Valuation Metrics.
Investment and Valuation Metrics
Investment and valuation metrics are crucial for assessing how effectively a company utilizes its capital to generate returns and how the market perceives its growth potential. These KPIs provide valuable insights for both business leaders and investors.
Key Investment Metrics:
- Return on Investment (ROI): Measures the profitability of investments and projects.
Importance: Reflects the efficiency of capital utilization. A higher ROI indicates a more effective use of resources.
- Return on Equity (ROE): Indicates how well a company generates profit from shareholders' equity.
Importance: A higher ROE suggests a more profitable company and effective management of shareholder capital. - Earnings Per Share (EPS): Represents the portion of a company's profit allocated to each outstanding share.
Importance: A higher EPS often correlates with a higher stock price and reflects better financial performance, benefiting investors.
Key Valuation Metrics:
- Price-to-Earnings Ratio (P/E): Compares the company's stock price to its earnings per share.
Importance: A high P/E suggests strong growth potential, indicating that the market expects future earnings growth.
- Market Cap: Total market value of a company, calculated by multiplying the stock price by the number of outstanding shares.
Importance: Provides insight into a company’s size and growth potential. Larger market caps often signify more established companies with stable revenue. - Dividend Yield: Reflects the percentage of a company's earnings paid to shareholders as dividends.
Importance: A high dividend yield can attract investors seeking stable returns, often preferred by those looking for passive income.
How These Metrics Influence Business Growth and Market Perception:
These metrics help determine how attractive a company is to investors. High ROI, ROE, and strong EPS indicate efficient use of capital and profitability, which boost market confidence. Similarly, a favorable P/E ratio and market cap highlight growth potential, while a good dividend yield attracts long-term investors.
INSIA's Role:
- Data-Driven Decision Making: INSIA integrates diverse financial data in real-time, offering clear insights into investment and valuation metrics, making it easier for businesses to track and optimize performance.
- Customizable Dashboards: Through seamless integration with various data sources, INSIA allows businesses to visualize these metrics in customizable dashboards, improving decision-making accuracy.
Having a comprehensive understanding of investment and valuation metrics is key to driving financial success. Let’s now turn our focus to Risk Management Metrics, where businesses can assess and mitigate potential financial risks effectively.
Risk Management Metrics
Risk management metrics help businesses assess their exposure to financial risks, including market volatility, liquidity risks, and debt management. By using these metrics, businesses can proactively manage risks, anticipate financial challenges, and safeguard long-term growth and stability.
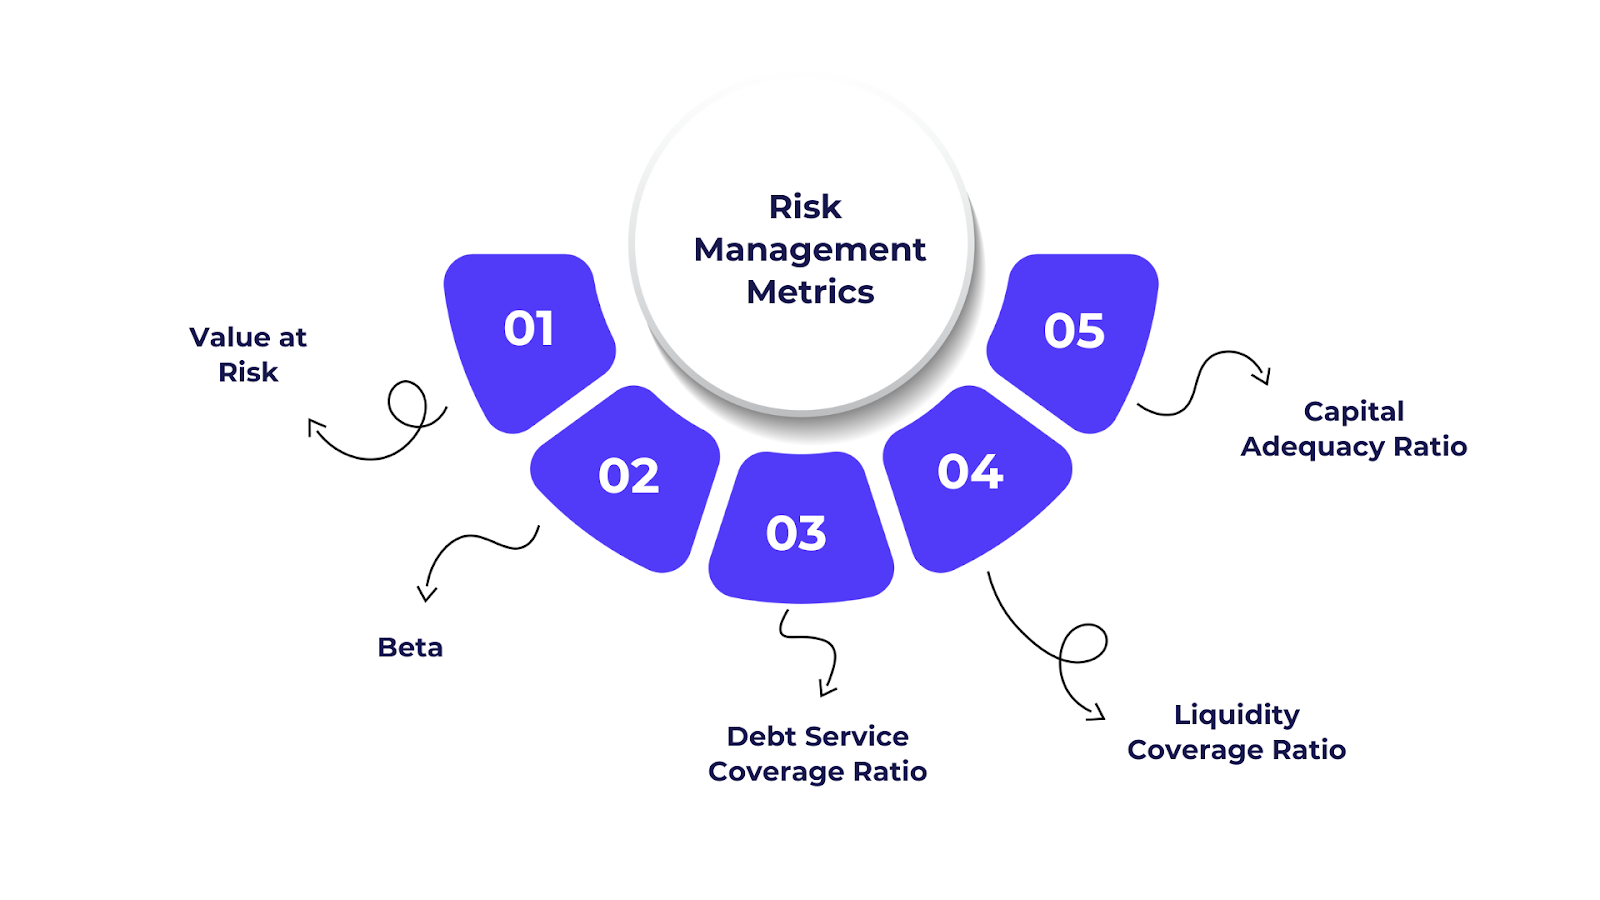
Key Risk Management Metrics:
- Value at Risk (VaR): Measures the potential financial loss in an investment portfolio over a specific time frame at a given confidence interval.
Importance: Helps businesses quantify risk and anticipate potential losses, aiding in risk mitigation and investment strategy. - Beta: Assesses a company’s volatility in comparison to the market.
Importance: A higher beta indicates greater volatility, suggesting higher risk. This metric helps investors assess the risk level of a stock relative to market movements. - Debt Service Coverage Ratio (DSCR): Determines a company’s ability to meet its debt obligations with its available income.
Importance: A ratio above 1 indicates sufficient cash flow to cover debt payments, demonstrating financial stability and reducing the likelihood of default. - Liquidity Coverage Ratio (LCR): Ensures a company can meet its short-term financial obligations with its most liquid assets, especially during times of market stress.
Importance: A higher LCR indicates a business's ability to withstand financial crises, ensuring liquidity in times of uncertainty. - Capital Adequacy Ratio (CAR): Measures the ability of banks and financial institutions to absorb losses and sustain financial stability.
Importance: A key indicator of long-term financial health, helping to assess whether an institution can withstand economic downturns and regulatory requirements.
How These Metrics Help Mitigate Financial Risks:
Risk management metrics allow businesses to anticipate potential financial pitfalls, reduce exposure to market volatility, and plan for unforeseen financial disruptions. By continuously tracking and analyzing these metrics, organizations can make more informed decisions and safeguard their long-term stability.
INSIA’s Role:
- Predictive Analytics:
INSIA’s AI-powered analytics help businesses forecast potential financial risks and manage them effectively by providing real-time insights and trend analysis. - Centralized Risk Reporting:
INSIA’s platform consolidates risk data from various sources, offering a comprehensive view of risk exposure and enabling immediate decision-making.
Also Read: Leveraging the Power of Predictive Analytics in Procurement: Use Cases and Insights
As businesses work to ensure financial stability, understanding and adapting their financial KPIs is crucial. Let’s now explore how aligning these KPIs can set the foundation for Business Success.
Adapting Financial KPIs for Business Success
Financial KPIs are not static; they require ongoing monitoring to ensure they reflect the current state of the business. Regular updates to KPIs are crucial for businesses to maintain a clear understanding of their financial health and performance.
- Timely Decisions: Real-time data insights allow businesses to respond quickly to financial changes, adapting their strategy as necessary.
- Sustained Growth: Continuous tracking of KPIs ensures that the business stays aligned with its financial goals and maintains growth over time.
How to Adapt Financial KPIs as Business Evolves
As businesses evolve, the KPIs they track should evolve as well. Changes in business conditions, growth, or external factors such as market conditions or regulatory changes will require businesses to adapt their KPIs. Here’s how:
- Business Growth: As a company expands, its KPIs may shift to accommodate new markets, products, or services.
- Market Shifts: External factors like economic downturns or market shifts may necessitate adjusting KPIs to reflect changes in strategy or risk.
- Regulatory Changes: New regulations can impact key financial metrics, requiring businesses to adapt their KPIs to ensure compliance.
As businesses monitor and adapt their financial KPIs, they must also leverage the right technology for effective management. INSIA’s role offers advanced tools for seamless KPI integration and real-time tracking. Let’s explore how.
Leveraging Technology for KPI Management: INSIA’s Role
As businesses face increasing pressure to make data-driven decisions, effective KPI tracking has become a competitive advantage. Traditional methods often result in delayed insights and increased manual work. INSIA's no-code platform streamlines KPI management, providing real-time visibility and automated reporting to enhance decision-making.
Simplifying KPI Tracking with INSIA's No-Code Platform
INSIA streamlines KPI tracking through its intuitive, no-code platform, allowing businesses to manage financial performance efficiently. Key features include:
- Real-time Dashboards: Provides live insights into KPIs, enabling businesses to monitor key metrics across departments instantly.
- Automated Reporting: Reduces manual intervention by automating the generation of reports, saving time and reducing human error.
- Customizable Views: Tailor dashboards to suit specific business needs, helping decision-makers access relevant data effortlessly.
INSIA’s platform offers a centralized hub to manage financial KPIs, ensuring consistent and actionable insights across the organization. This empowers businesses to make informed decisions promptly, without the complexities of traditional data management systems.
How INSIA’s Data Integration Capabilities Enhance KPI Reporting
INSIA’s seamless data integration capabilities play a critical role in ensuring that financial KPI reporting is accurate and consistent across all business units. By integrating data from various sources, such as CRMs, ERPs, and IoT systems - INSIA:
- Ensures Consistency: Provides a single source of truth for financial data, eliminating discrepancies between systems.
- Improves Accuracy: Real-time data synchronization across multiple platforms reduces the chances of errors in financial reporting.
- Enables Comprehensive Insights: Aggregates data from different departments, offering a holistic view of performance, which is crucial for better decision-making.
INSIA’s comprehensive data integration ensures businesses can trust the metrics they base their decisions on, ultimately improving financial management across the organization.
As we now explore the broader picture, let’s see how you can adapt these KPIs to foster sustained business success.
Conclusion
To recap, financial KPIs play a pivotal role in business decision-making, providing valuable insights into company performance, profitability, and operational efficiency. They help businesses evaluate financial health and ensure they stay on track toward their long-term objectives. Constant monitoring and adapting these KPIs in response to shifting market conditions and evolving business strategies is crucial for sustaining growth and profitability.
INSIA offers businesses a platform for managing KPIs, with real-time data synchronization, customizable dashboards, and AI-driven analytics to simplify tracking and decision-making. By seamlessly integrating various data sources, INSIA empowers businesses to gain actionable insights, enhancing both strategic and financial outcomes. With INSIA’s no-code solution, your business can streamline KPI management and stay ahead of market changes.
FAQs
1. What financial KPIs are most important for startups?
Key KPIs include revenue growth, customer acquisition cost (CAC), gross profit margin, and burn rate, which help startups gauge their financial health and growth potential.
2. How often should businesses track financial KPIs?
Financial KPIs should be tracked regularly - at least monthly or quarterly - to make timely decisions and adjust strategies based on performance.
3. What’s the difference between lagging and leading financial indicators?
Lagging indicators reflect past performance (e.g., net profit), while leading indicators predict future trends (e.g., customer acquisition rate).
4. Can financial KPIs be customized by industry?
Yes, financial KPIs can be tailored to industry-specific needs, with different metrics prioritized based on business type and goals.
5. How do financial KPIs support investor relations?
Financial KPIs provide investors with insights into profitability, growth, and risk, helping build trust and transparency in business performance.
6. What’s the role of visual dashboards in financial KPI tracking?
Visual dashboards provide an easily digestible, real-time overview of financial KPIs, helping businesses make informed, data-driven decisions quickly. With INSIA’s no-code platform, companies can create customizable, interactive dashboards that simplify data interpretation, enabling quick, informed decision-making.
7. How do you choose the right financial KPIs for your business?
Select KPIs that align with your business goals, focus on key performance drivers, and reflect your industry’s unique challenges and opportunities.
8. Are financial KPIs the same as accounting metrics?
No, financial KPIs focus on performance and growth, while accounting metrics typically track historical financial data like profit and loss.
9. Can AI improve financial KPI analysis?
Yes, AI can enhance financial KPI analysis by automating data processing, providing predictive insights, and offering more accurate forecasting. INSIA’s AI-powered platform helps businesses optimize their financial performance with real-time, data-driven insights, ensuring smarter, faster decisions.
10. What KPI indicates if my business can pay its short-term obligations?
The current ratio and quick ratio measure a business’s ability to meet short-term obligations using its current assets.
11. How do operational KPIs link to financial KPIs?
Operational KPIs (e.g., inventory turnover, asset utilization) influence financial KPIs (e.g., profit margins, ROI) by optimizing resources and reducing costs.
12. What are common mistakes to avoid when tracking financial KPIs?
Avoid using irrelevant KPIs, failing to track them regularly, or ignoring the context behind the numbers, which can lead to misguided decisions.

.png)


.png)


.png)

.png)
