
Manufacturers often face the challenge of managing fragmented warranty data across multiple systems, leading to inefficiencies, delayed claims, and increased operational costs. Inconsistent data quality and a lack of real-time insights further complicate effective decision-making. Addressing these pain points is crucial for improving product quality, enhancing customer satisfaction, and reducing warranty expenses.
This blog will explore how warranty analytics can solve these issues with real-world examples and warranty analytics case study insights.
We'll cover key benefits, use cases, implementation challenges, and how strategic analytics can transform your warranty management process.
Understanding Warranty Analytics
Warranty analytics involves leveraging data from various sources—customer information, equipment details, and usage metrics—to predict, assess, and manage warranty claims effectively. As manufacturers move towards data-driven decision-making, warranty analytics transforms how businesses handle warranty costs, claims, and service operations.
For example, a manufacturer using predictive analytics can identify recurring defects in specific components before they lead to costly repairs, allowing for early product design or customer service intervention.
However, the approach can vary when it comes to utilizing warranty data. Manufacturers can either focus on:
- Real-time analysis: Provides immediate insights into current issues.
- Historical analysis: Looks at past data to uncover long-term trends.
Both methods offer distinct advantages depending on the goals and challenges of the business.
Here's a comparison of real-time vs. historical warranty data analysis:
| Aspect | Real-Time Data Analysis | Historical Data Analysis |
|---|---|---|
| Focus | Active, ongoing warranty claims and equipment issues | Long-term trends and recurring issues over time |
| Benefits | Immediate identification of failures; proactive interventions | In-depth insights into product performance trends |
| Use Case Example | Identifying issues with a specific batch of equipment based on live data | Analyzing past warranty claims to identify frequent component failures |
| Impact on Operations | Faster decision-making, immediate response to issues | Informing product development and future warranty policies |
| Data Source | Real-time data from IoT sensors, product usage, customer feedback | Historical warranty data from previous claims and repair logs |
Did you know that the warranty management market is rapidly transitioning toward integrated, data-centric platforms to address complex manufacturing challenges?
The projected growth of the Warranty Management System Market from USD 5.70 billion in 2025 to USD 7.75 billion by 2034 underscores a strategic shift toward analytics-driven solutions. With a CAGR of 3.46%, the market increasingly favors advanced analytics that drive product quality optimization, operational cost reduction, and improved customer experience.
For manufacturing leaders, this trend reflects rising demand for platforms capable of consolidating real-time and historical warranty data.
Also Read: Understanding Elements of Analytical Quality Control and Assurance
With foundational concepts defined, let’s examine specific use cases demonstrating warranty analytics’ role in quality and cost control.
Use Cases in Warranty Analytics
The North America extended warranty market reached USD 69.48 billion in 2024 and is growing at 8.95% CAGR, showing the increasing demands on warranty management.
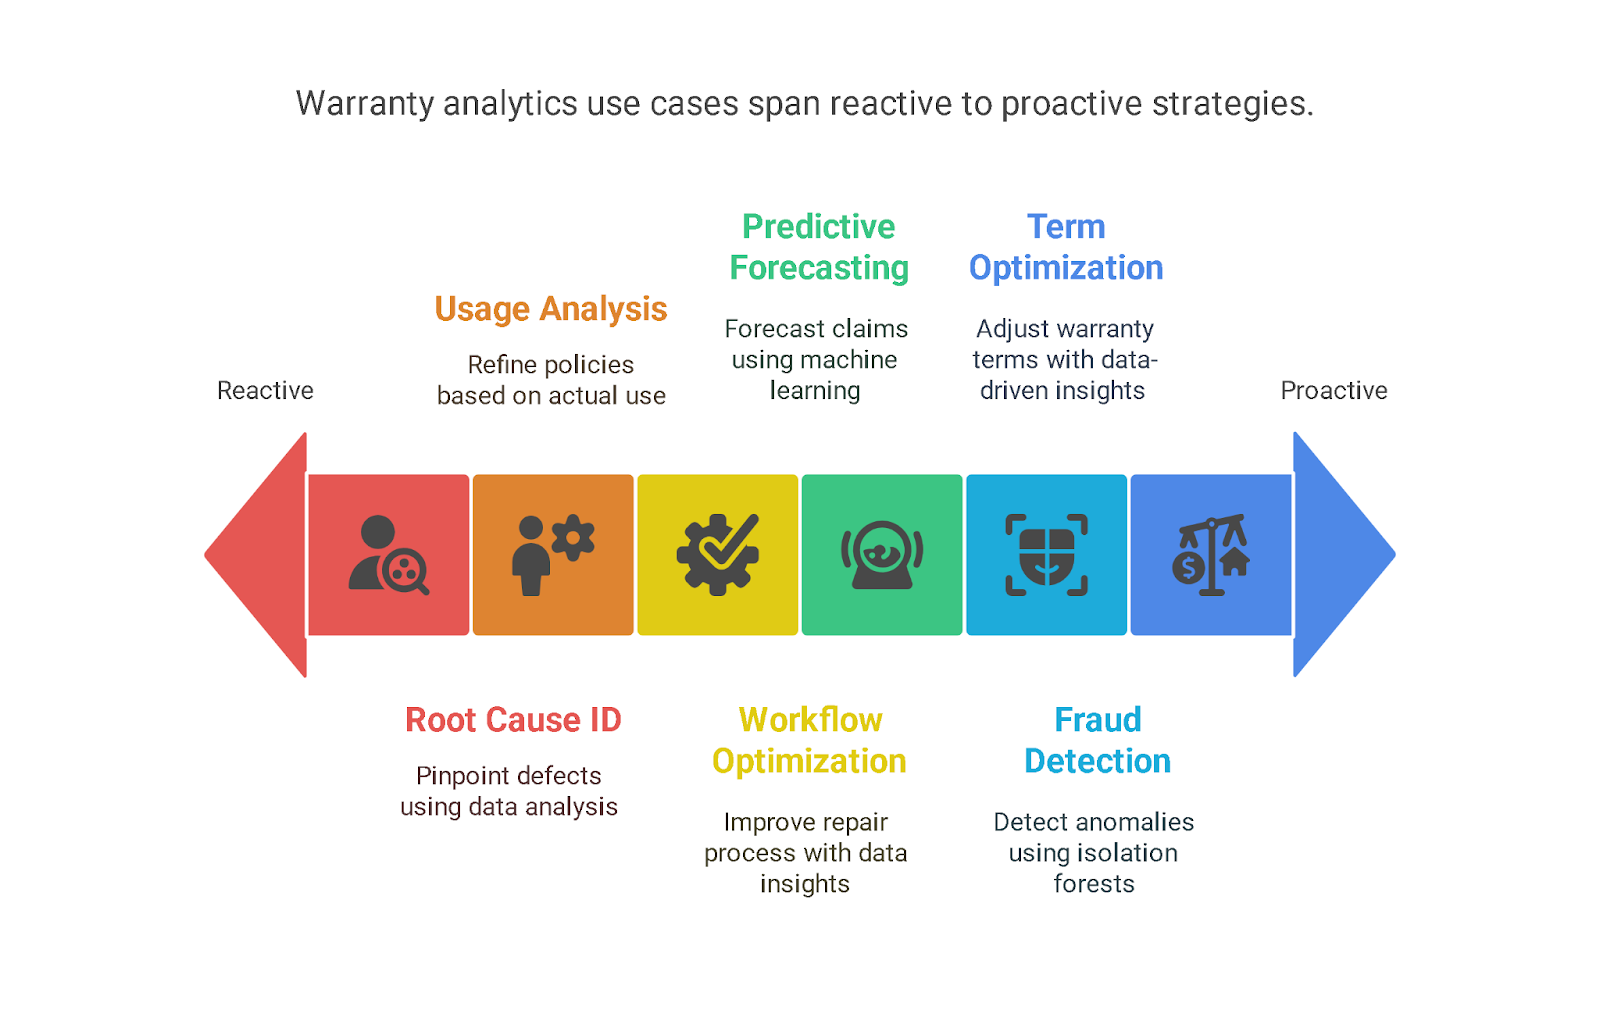
Knowing specific warranty analytics use cases helps manufacturers apply data effectively to lower costs and improve product reliability as warranty programs grow in scale.
1. Root Cause Identification for Product Quality and Safety
Manufacturers use warranty analytics to correlate claims with component-level failure data, production batches, and supplier information. Advanced statistical methods like clustering and multivariate analysis help isolate defect patterns linked to specific manufacturing variables.
For instance, an automotive OEM might apply Bayesian networks to warranty and assembly line data, identifying a supplier batch causing brake actuator failures. These insights enable precision recalls and targeted engineering redesigns, reducing liability risks and improving compliance with automotive safety standards such as FMVSS (Federal Motor Vehicle Safety Standards).
2. Usage Pattern Analysis to Differentiate Wear from Misuse
Combining warranty claims with sensor telemetry and operational data enables distinguishing legitimate wear from customer misuse or abuse. Techniques like time-series anomaly detection and unsupervised learning models analyze vibration, temperature, and load profiles.
Heavy equipment manufacturers, for example, integrate telematics data with warranty claims to segment failures caused by harsh operating conditions versus operator error. This granularity informs adaptive warranty policies and supports targeted operator training programs to mitigate misuse-driven failures, optimizing warranty cost control.
3. Optimization of Repair and Service Workflows
Warranty analytics provides granular labor and parts usage data, enabling workflow refinement through process mining and simulation. An appliance manufacturer may analyze average repair times and common failure modes, applying discrete-event simulation to optimize technician dispatch schedules and parts stocking strategies.
Predictive models identify bottlenecks or recurrent inefficiencies, informing continuous improvement cycles and reducing warranty service costs while improving customer satisfaction through faster resolution times.
4. Predictive Forecasting of Warranty Claims and Costs
Machine learning models utilize historical warranty claims, product lifecycle parameters, environmental factors, and usage intensity metrics to forecast future claim volumes and expenditures. Time-series forecasting methods like ARIMA (AutoRegressive Integrated Moving Average) and LSTM (Long Short-Term Memory) neural networks enable manufacturers to anticipate seasonal spikes or geographic hotspots of claims.
For example, construction equipment firms predict increased hydraulic system failures during winter, enabling preemptive inventory positioning. Such predictive capabilities enhance budgeting accuracy and supply chain agility, minimizing stockouts and excessive carrying costs.
5. Fraud Detection through Anomaly and Pattern Recognition
Sophisticated fraud detection leverages supervised and unsupervised algorithms to analyze claim frequency, repair costs, and customer metadata. Techniques such as isolation forests and clustering detect outliers indicative of fraudulent claims.
Consumer electronics manufacturers implement these models to flag abnormal repair patterns or geographically improbable claims, strengthening internal controls and reducing warranty losses. Integrating CRM (Customer Relationship Management) and field service data further refine fraud scoring models, improving detection precision.
6. Warranty Term Optimization Based on Empirical Data
Warranty analytics evaluates component failure distributions and repair costs using survival analysis and reliability engineering principles such as Weibull analysis. Manufacturers adjust warranty durations and exclusions based on empirical failure rates and cost-benefit analyses.
For instance, a power tool manufacturer might use failure hazard rates to shorten coverage on highly reliable parts while extending warranty on components prone to early wear. This data-driven tailoring ensures competitive warranties that minimize financial exposure without compromising customer confidence.
Next, we explore how warranty analytics enhances service workflows, optimizing parts management, supplier relations, and technician efficiency.
Improving Warranty Service Operations
A recent study show, in 2022, over 30% of organizations used public clouds, nearly 30% adopted hybrid clouds, and around 14% relied on on-premises environments.
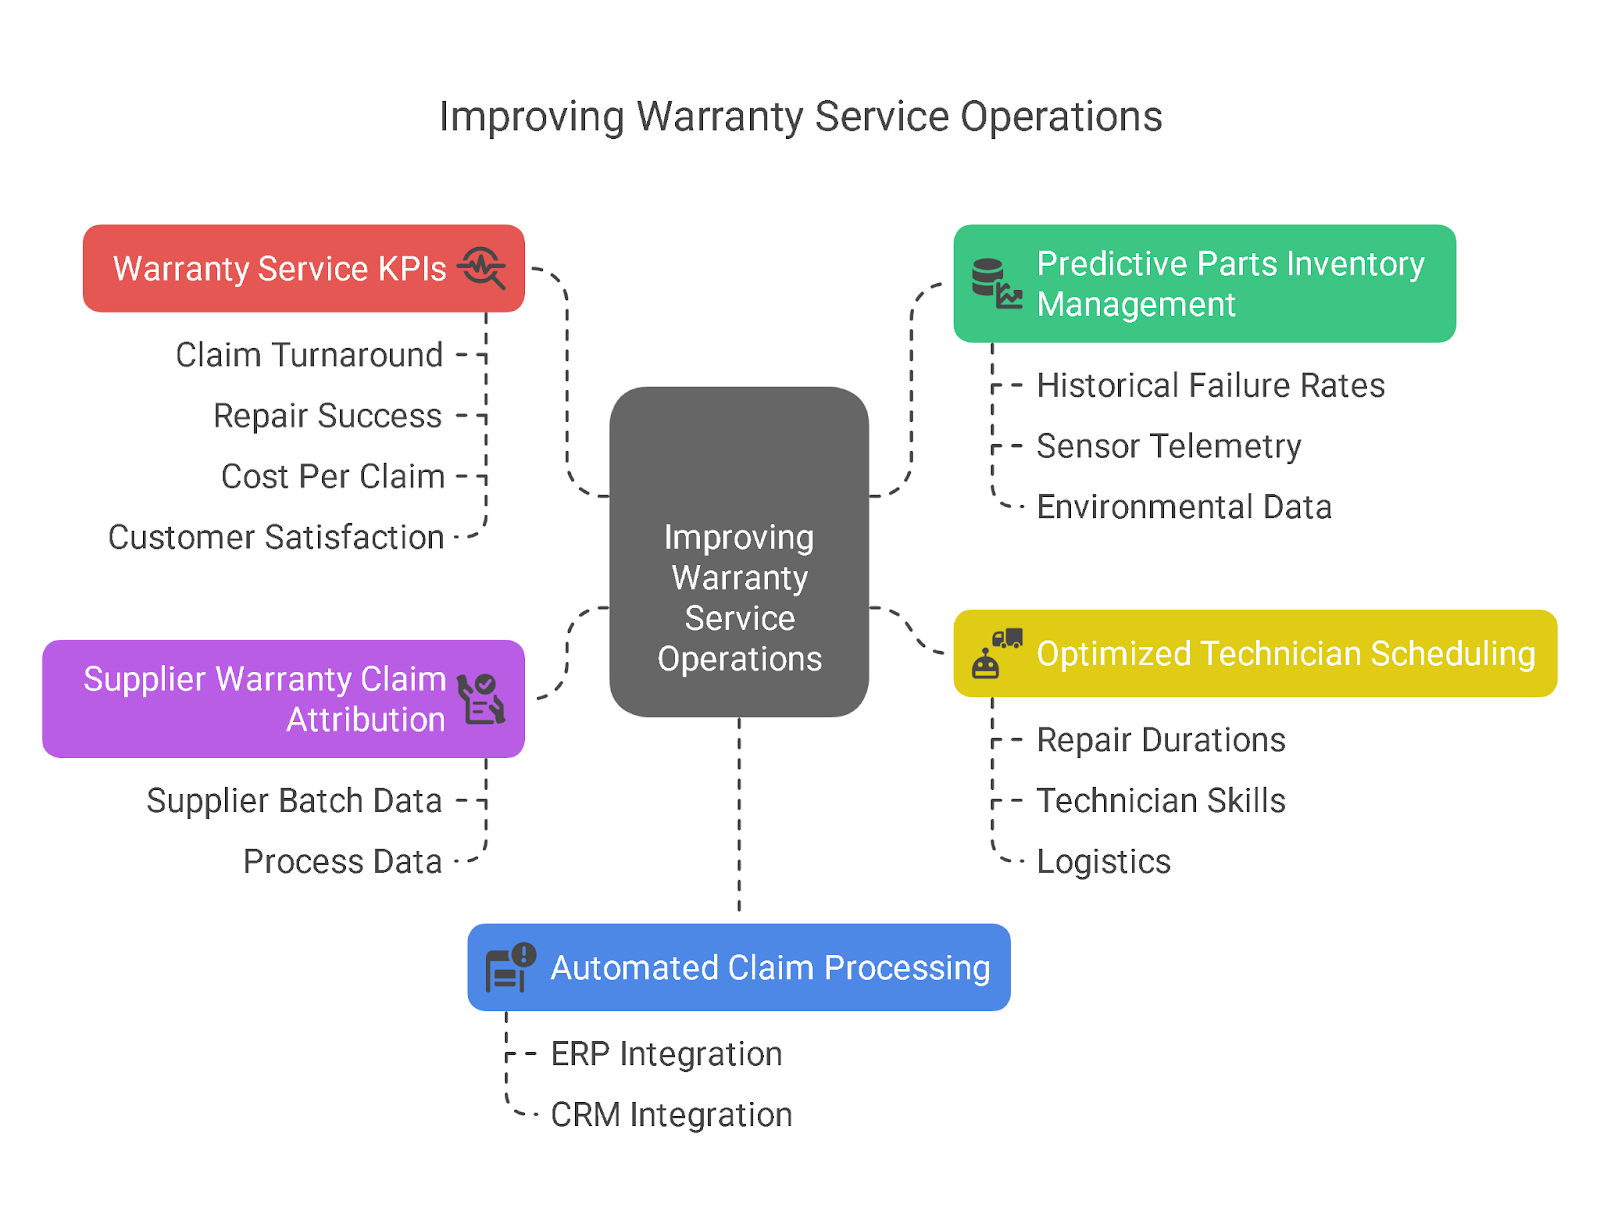
This shift lets manufacturers unify warranty data and automate processes, improving accuracy and response times. Below, we explore how advanced warranty analytics enhances inventory control, supplier management, technician scheduling, and performance tracking.
1. Predictive Parts Inventory Management
Manufacturers leverage advanced predictive analytics by combining historical failure rates, real-time sensor telemetry, and environmental usage data to develop probabilistic models forecasting part demand. Techniques such as survival analysis and stochastic modeling quantify failure likelihoods under varying operational stresses.
For instance, aerospace firms apply these models to turbine blade inventory, dynamically adjusting stock levels based on predictive Remaining Useful Life (RUL) estimations, thus minimizing holding costs while preventing critical part shortages that could delay scheduled maintenance.
2. Supplier Warranty Claim Attribution and Analysis
Sophisticated warranty analytics platforms integrate supplier batch records, manufacturing process data, and warranty claims through relational data models and machine learning classifiers. This enables precise fault attribution to specific suppliers or production lots.
Automotive OEMs utilize these insights to conduct targeted supplier performance evaluations, inform warranty cost-sharing negotiations, and drive corrective actions that improve component reliability and reduce future claims.
3. Optimized Service Technician Scheduling and Resource Allocation
Machine learning algorithms, including regression models and clustering techniques, analyze multi-dimensional data encompassing historical repair durations, technician expertise profiles, geographic locations, and traffic patterns. This data-driven scheduling optimizes dispatch sequences to reduce technician idle time and travel costs.
Heavy machinery manufacturers implement such models to assign specialized technicians only when equipment complexity demands it, boosting first-time fix rates and decreasing overall warranty labor expenditures.
4. Automated Warranty Claim Processing Workflows
Integration of warranty analytics with ERP (Enterprise Resource Planning) and CRM (Customer Relationship Management) systems facilitates end-to-end automation of claim validation, approval routing, and fraud detection.
AI models, such as anomaly detection and natural language processing (NLP), scrutinize claim data in real-time to flag inconsistencies and verify supporting documentation. Electronics manufacturers employing these automated workflows report significant reductions in claim processing time, administrative overhead, and false claims, enhancing operational efficiency.
Also Read: Understanding Production Analysis
5. Development and Monitoring of Warranty Service KPIs
Customizable analytics dashboards aggregate key performance indicators—including average claim turnaround time, repair success ratios, cost per claim, and customer satisfaction scores—leveraging real-time data visualization and alerting.
These tools enable warranty managers to pinpoint operational bottlenecks, track technician productivity, and monitor compliance with service-level agreements (SLAs). Consumer appliance manufacturers use such KPI-driven insights to benchmark team performance, optimize resource allocation, and refine warranty strategies aligned with corporate objectives.
Understanding operational improvements, we now detail a stepwise approach to successfully deploying warranty analytics solutions.
Implementing Warranty Analytics: A Step-by-Step Guide
A structured approach to implementing warranty analytics ensures manufacturers can effectively harness data for actionable insights. Understanding each step reduces integration risks, optimizes resource use, and accelerates time-to-value in warranty management systems.
- Step 1: Data Collection and Integration
Gather warranty data from diverse sources, including ERP (Enterprise Resource Planning), CRM (Customer Relationship Management), service logs, and IoT devices. Use ETL (Extract, Transform, Load) processes and APIs to consolidate heterogeneous data into a centralized data lake or warehouse, ensuring high data quality and consistency.
- Step 2: Data Preprocessing and Cleaning
Apply normalization, de-duplication, and anomaly detection to prepare data for analysis. Address missing values and correct inconsistencies to reduce noise and improve model accuracy. Synchronize timestamp data across systems to maintain temporal alignment for precise analytics.
- Step 3: Model Selection and Development
Choose appropriate analytical models based on the warranty use case—classification models for fraud detection, regression for cost forecasting, or clustering for failure pattern identification. Employ supervised, unsupervised, and time-series algorithms tailored to the data characteristics and business objectives.
- Step 4: No-Code/Low-Code Platform Deployment
Leverage no-code or low-code platforms to empower warranty teams to build, customize, and iterate predictive models without extensive programming knowledge. This democratizes AI usage, enabling faster model adaptation and operational flexibility.
- Step 5: Dashboard Creation and Role-Based Access
Develop interactive dashboards with real-time data visualization tailored to different stakeholder roles—technicians, managers, and executives. Implement role-based access controls (RBAC) to secure sensitive information and deliver relevant insights to the right users.
- Step 6: Automation of Alerts and Workflows
Integrate predictive analytics outputs with automated notification systems to trigger proactive warranty claim handling. Implement workflow automation for claim approvals, supplier notifications, and inventory replenishment to reduce manual processing and speed response times.
- Step 7: Continuous Monitoring and Model Refinement
Establish ongoing performance tracking of predictive models using KPIs like accuracy, recall, and false favorable rates. Use feedback loops and retraining mechanisms to adapt models to evolving product data and operational changes, ensuring sustained reliability.
Before full deployment, manufacturers must address technical and organizational challenges that impact warranty analytics effectiveness.
Challenges in Warranty Analytics
With over 55% of businesses investing in automated warranty tools due to rising product complexity and consumer expectations, addressing technical and organizational challenges is crucial.
Overcoming these hurdles ensures accurate insights, faster claims handling, and maximizes the return on warranty analytics investments. So, let's focus on some of the most common challenges below.
1. Data Quality and Consistency
Manufacturing environments generate vast amounts of heterogeneous data from ERP, CRM, IoT sensors, and service logs. Inconsistencies arise from missing entries, time misalignments, and noise, degrading model performance. Rigorous data validation, cleaning algorithms, and timestamp synchronization are necessary to maintain integrity and reduce false positives or negatives.
2. Integration of Legacy and Modern Systems
Most manufacturers operate a hybrid IT landscape combining legacy equipment and modern IoT-enabled assets. Data formats, communication protocols, and interfaces vary widely, complicating real-time data aggregation. Middleware solutions and standards such as OPC Unified Architecture (OPC UA) help bridge these gaps but require specialized knowledge and careful architecture design.
3. Selection of Analytical Models
Choosing suitable models depends on the nature of warranty data and specific business needs. For example, classification models excel in fraud detection, while time-series forecasting suits claim volume predictions. Overfitting, underfitting, and interpretability challenges demand ongoing validation and model tuning.
4. Handling Unstructured Data
Warranty claims often include unstructured text, images, and video from service reports or customer feedback. Extracting actionable insights requires advanced techniques such as natural language processing (NLP) and computer vision. Integrating these into existing analytics pipelines adds complexity and computational overhead.
5. Organizational Resistance and Change Management
Transitioning to analytics-driven warranty management challenges established workflows and job roles. Resistance may stem from fear of job displacement or mistrust of AI outputs. Addressing this requires clear communication, user-friendly tools, and training programs to foster adoption.
6. Skills Gap in Warranty Teams
Deploying and maintaining warranty analytics demands expertise in data science, domain knowledge, and IT systems. Many maintenance and warranty teams lack these capabilities, necessitating hiring or upskilling efforts. Collaborations with analytics vendors or consultants often bridge this gap.
7. Cybersecurity and Data Privacy
Integrating operational technology (OT) with IT networks increases vulnerability to cyber threats. Protecting sensitive warranty data mandates multi-layered security, including encryption, access controls, network segmentation, and compliance with regulations like GDPR or HIPAA where applicable.
Also Read: Effective Line Management in Manufacturing Production
Overcoming these hurdles unlocks strategic advantages, driving measurable gains in product quality, cost efficiency, and customer satisfaction.
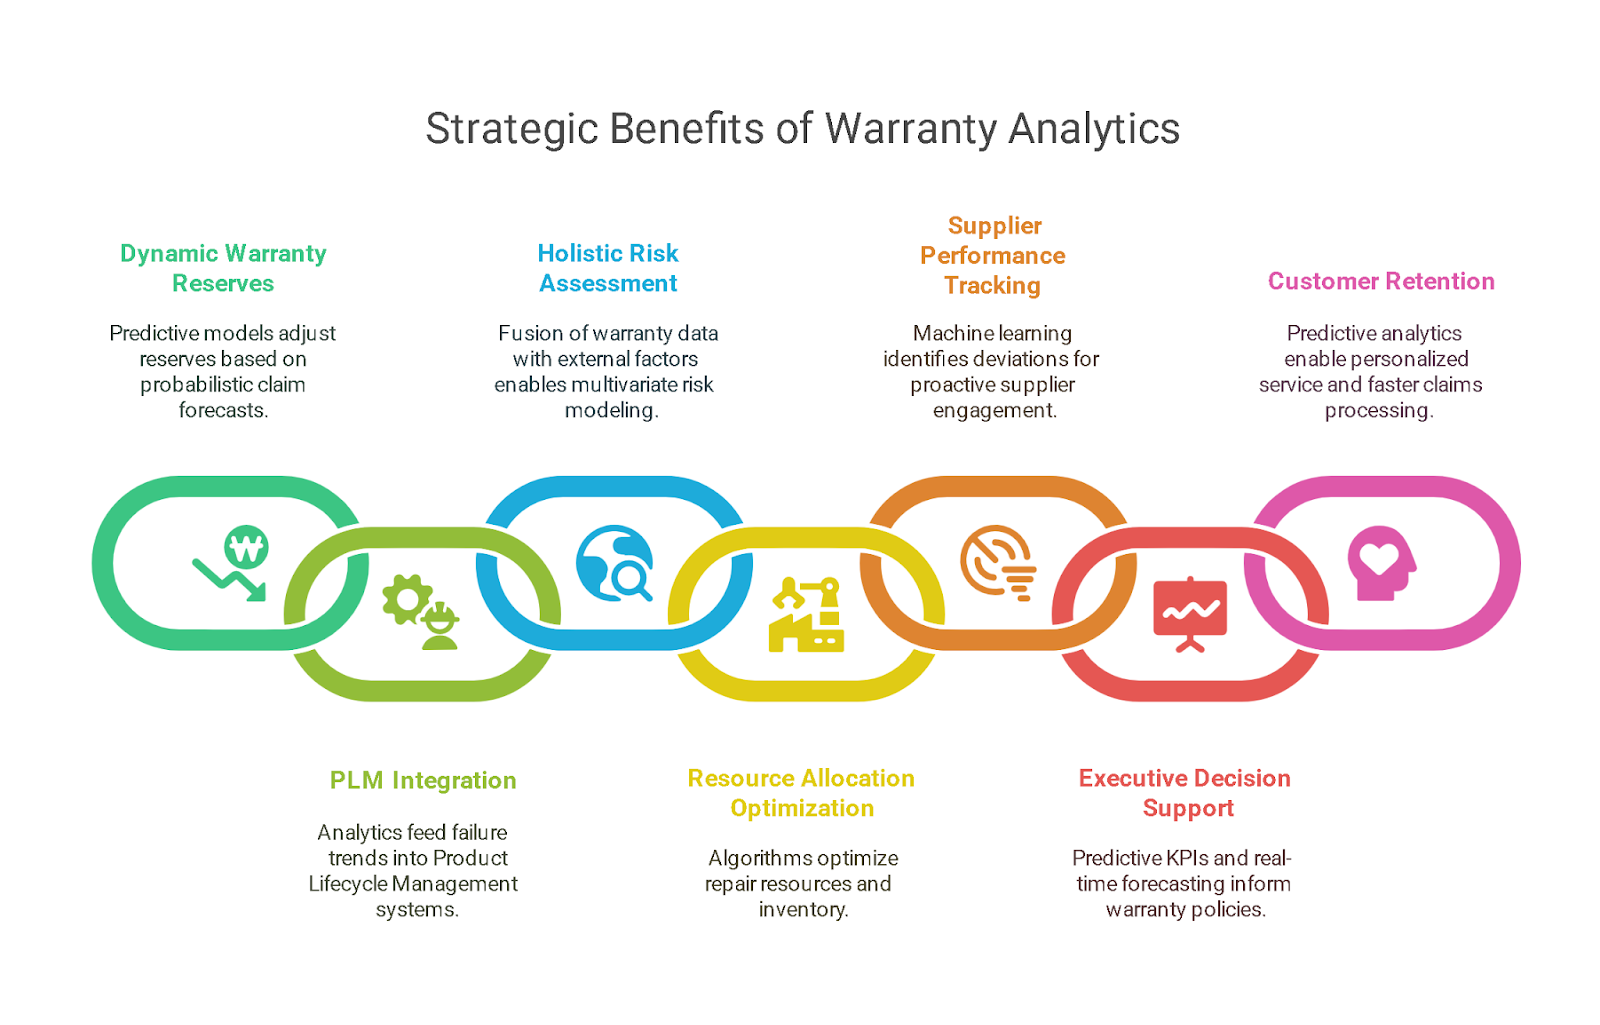
Strategic Benefits of Warranty Analytics
In 2024, the manufacturing segment held the largest share of the warranty analytics market.
This reflects the growing need to manage complex warranties for machinery and industrial assets efficiently. Converting raw warranty data into precise insights enhances operational control and decision-making.
Let's explore the key strategic benefits that make warranty analytics indispensable for manufacturers.
1. Quantitative Reduction in Warranty Reserves and Financial Risk
Advanced predictive models enable manufacturers to adjust warranty reserves dynamically based on probabilistic claims frequency and severity forecasts. By integrating stochastic modeling with product lifecycle data, firms minimize overprovisioning capital, freeing resources for innovation while ensuring regulatory compliance with financial reporting standards such as ASC 460.
2. Enhanced Product Lifecycle Management (PLM) Integration
Analytics-driven insights seamlessly feed into PLM systems, providing engineering teams with granular failure mode trends linked to design variables and supplier quality metrics. This direct feedback loop accelerates root cause correction, reduces time-to-market for improved product versions, and supports data-driven warranty extensions or recall decisions.
3. Cross-Domain Data Fusion for Holistic Risk Assessment
Combining warranty data with external factors—like environmental conditions, usage telemetry, and field service histories—allows multivariate risk modeling. Manufacturers can segment products by geography, customer profile, or operating environment to tailor warranty terms and prioritize field support strategically.
4. Operational Cost Optimization via Resource Allocation Modeling
Warranty analytics supports optimization algorithms that allocate repair resources, parts inventory, and technician hours based on predicted claim volumes and complexity. Scenario simulations quantify cost-benefit tradeoffs of alternative warranty policies or service models, enabling finance and operations teams to align budgets tightly with projected liabilities.
5. Improved Supplier Performance and Accountability Tracking
Data-driven supplier scorecards integrate warranty claims attribution with quality audits and delivery metrics. Manufacturers leverage advanced machine learning classifiers to identify statistically significant deviations, enabling proactive supplier engagement, risk mitigation, and cost-sharing agreements aligned with warranty outcomes.
6. Executive-Level Decision Support with Customizable KPIs and Forecasting
Interactive analytics platforms provide leadership with predictive KPIs such as expected claim escalation timelines, cost per failure, and warranty liability exposure under various scenarios. Real-time forecasting tools support strategic planning for warranty policy adjustments, product portfolio risk balancing, and capital allocation decisions.
7. Customer Retention and Satisfaction through Predictive Service
Predictive warranty analytics enables personalized service offers, preemptive fault notifications, and streamlined claims processes that reduce resolution times. This data-driven customer engagement strengthens brand loyalty by minimizing downtime and elevating the overall ownership experience.
Let’s review real-world examples showcasing how manufacturers translate warranty analytics strategies into tangible business value.
Case Studies: Real-World Applications
Exploring warranty analytics case study examples provides valuable insights into how manufacturers apply data-driven solutions to improve product quality and operational efficiency.
The following real-world cases demonstrate the measurable impact of advanced analytics on reducing warranty claims and optimizing cost management across industries.
1. General Motors Enhances Warranty Management Through Predictive Analytics
In response to escalating warranty liabilities, especially related to the Chevy Bolt EV battery recall, General Motors turned to predictive analytics to gain control over quality and cost issues:
Challenge:
- The Chevy Bolt EV battery defect led to $2 billion in warranty accruals in 2021.
- By 2023, the total cost had risen to $2.6 billion.
Solution:
- GM deployed advanced predictive analytics to process warranty claims data.
- The system continuously monitored and correlated warranty trends with production, design, and usage variables.
Results:
- Enabled early detection of potential quality defects before they escalated.
- Empowered cross-functional teams to act on insights, avoiding wider systemic failures.
- Strengthened GM's ability to launch data-driven recalls and preemptively address reliability concerns.
- This resulted in measurable improvements in product quality, reduced long-term warranty costs, and increased customer satisfaction.
2. Ford Motor Company Leverages Predictive Analytics to Reduce Warranty Costs
With warranty-related expenses significantly impacting margins, Ford Motor Company invested in AI-driven maintenance and analytics systems to reverse the trend:
Challenge:
- In Q2 2024 alone, Ford reported an $800 million rise in warranty expenses.
- Legacy issues from vehicle models launched in 2021 or earlier contributed heavily to this spike.
Solution:
- Implemented predictive analytics and machine learning to track warranty claims in real time.
- Integrated data from connected vehicles and diagnostic trouble codes (DTCs) to identify emerging issues.
- Developed a predictive maintenance model to forecast equipment failures with 22% accuracy up to 10 days in advance, maintaining a low 2.5% false-positive rate.
Results:
- Prevented over 122,000 hours of vehicle downtime.
- Saved an estimated $7 million through proactive maintenance interventions.
- The Integrated Vehicle Systems (IVS) project enabled remote reprogramming of vehicle electronics, helping Ford avoid over $100 million in module replacement costs over three years.
- Reduced field service costs and accelerated issue resolution across Ford's fleet.
Also Read: Top 10 Data Analytics Tools You Need to Master in 2025
Building on these cases, we examine how INSIA’s platform centralizes data and accelerates warranty analytics implementation.
How INSIA Empowers Warranty Analytics?
Managing warranties in manufacturing or service-driven sectors involves tracking failure patterns, analyzing service claims, and identifying systemic issues across products, geographies, and timeframes.
INSIA simplifies this complex data landscape and delivers actionable insights that help teams reduce warranty costs, improve product reliability, and enhance customer satisfaction.
1. Centralized Warranty Data Across Systems
Warranty data often resides across ERPs, service management systems, CRM platforms, and spreadsheets. INSIA's integration module brings all this fragmented information into a single platform, enabling a centralized view of claims, parts replaced, failure modes, and customer complaints.
With pre-built connectors for major ERP and CRM systems, warranty teams can eliminate manual data collection and reduce errors from system silos.
2. Real-Time Failure Pattern Detection
INSIA's Push AI and Predictive Analytics modules can identify and alert teams to real-time emerging product failure trends. By analyzing claim frequencies, part numbers, and service durations, INSIA helps you:
- Detect anomalies or spikes in warranty claims early
- Spot defective components or manufacturing issues faster
- Correlate failures with batch numbers, locations, or production lines
This proactive insight allows engineering and service teams to act before warranty costs spiral out of control.
3. Customized Dashboards for Role-Based Analysis
With INSIA's dashboarding and reporting tools, warranty, service, and quality teams can build custom views of the data without technical assistance:
- Track KPIs such as cost per claim, return rates, and average resolution time
- Filter by product line, customer region, or service center
- Share dashboards across departments to ensure everyone's working with the same insights
Executives can get high-level snapshots, while service managers can drill into specific cases.
4. AI-Powered Warranty Forecasting
Using INSIA's no-code predictive modeling, you can train models to forecast future warranty claim volumes based on historical data. This helps in:
- Budgeting for upcoming warranty liabilities
- Planning spare parts inventory
- Adjusting service staffing levels
- Preemptively improving designs or supplier quality
All this can be done without needing data science expertise, making advanced analytics accessible to warranty managers.
5. Improved Compliance & Audit Readiness
Warranty claims can involve regulatory audits or internal reviews. INSIA's Governance Module ensures:
- Role-based access control, so sensitive data is secure
- Automated backups for audit trail integrity
- Data lineage tracking, making it easy to trace back how insights were derived
This makes reporting more transparent and reduces the time and effort needed for compliance documentation.
6. Reduced Manual Reporting Effort
Traditionally, warranty analysis involves creating manual reports across departments. INSIA automates this through:
- Scheduled and automated reporting to send regular updates to stakeholders
- Natural-language search and smart filters that reduce dependency on IT or analysts
- Self-serve dashboards, allowing regional teams to explore data specific to their markets
Want to see real results? Check out INSIA’s success stories to learn how manufacturers have improved warranty outcomes and operational efficiency.
Conclusion
Warranty analytics case study insights show how manufacturers transform the management of complex warranty programs, delivering critical data that enhances product quality, reduces costs, and improves customer satisfaction. Overcoming data integration and operational challenges unlocks its full potential, driving measurable business value.
By transforming fragmented warranty data into centralized, real-time insights, INSIA allows businesses to minimize losses, anticipate warranty costs, and deliver better customer experiences. Whether you're identifying trends, ensuring compliance, or forecasting future claims, INSIA helps you stay ahead without technical complexity.
Ready to take control of your warranty data?