Global ecommerce sales are expected to surpass $6.8 trillion in 2025, and will reach the $8 trillion mark by 2027. Considering this, ecommerce analytics is trending as well. For those unaware, ecommerce analytics gives companies visibility into how customers discover products, interact with websites, and make purchases, providing a foundation for continuous growth.
With competition just a click away, relying on instinct or guesswork can lead to missed opportunities and wasted resources. Analytics enables businesses to act with confidence, identifying trends, uncovering hidden issues, and shaping strategies based on evidence rather than assumptions.
In this article, let’s have a look at ecommerce analytics and understand this concept thoroughly.
What is Ecommerce Analytics?
Ecommerce analytics refers to the process of collecting, analyzing, and interpreting data from online retail platforms to understand business performance and customer behavior. It connects sales data, marketing performance, and customer interactions into one comprehensive view.
Difference Between Ecommerce Analytics and General Web Analytics
While general web analytics (like tracking website traffic, bounce rate, or session duration) focuses on overall website performance, ecommerce analytics dives deeper into the commercial side of online business.
Here’s a clear and concise table highlighting the difference between ecommerce analytics and general web analytics:
| Feature / Aspect | General Web Analytics | Ecommerce Analytics |
|---|---|---|
| Primary Focus | Website performance, user behavior, engagement | Revenue generation, customer behavior, sales impact |
| Key Metrics | Page views, bounce rate, session duration | Conversion rate, AOV, CLV, CAC, repeat purchases |
| Goal | Understand visitor activity and engagement | Optimize sales, marketing ROI, and customer experience |
| Data Scope | Website interactions (clicks, navigation) | Website + transactions, product performance, multi-channel touchpoints |
| Decision-Making Use | Improve site usability and content strategy | Drive sales, reduce cart abandonment, enhance personalization |
Core Goals of Ecommerce Analytics
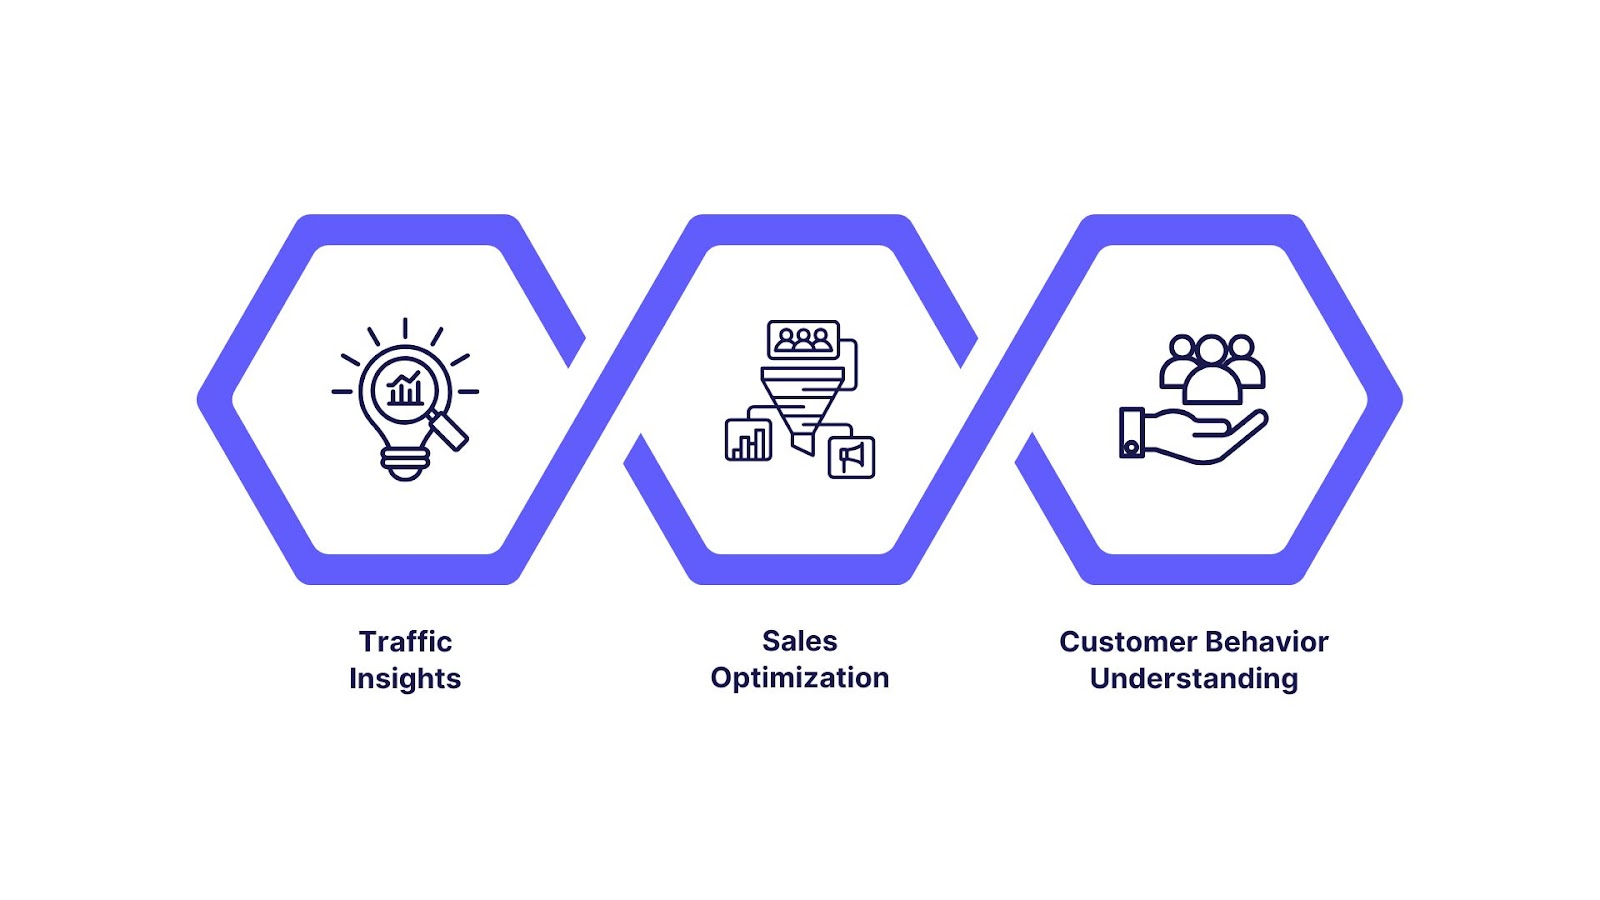
The scope of ecommerce analytics centers on three primary goals:
- Traffic Insights: Understanding where visitors come from (organic search, paid ads, social, email) and which channels deliver the highest-quality leads.
- Sales Optimization: Monitoring the sales funnel, identifying bottlenecks like cart abandonment, and testing strategies to boost conversions.
- Customer Behavior Understanding: Tracking how customers browse, what they buy, and when they return, helping businesses personalize experiences and improve retention.
Ultimately, ecommerce analytics equips businesses with the insights needed to make informed decisions that drive growth, efficiency, and long-term customer loyalty.
Why Ecommerce Analytics Matters?
Ecommerce analytics provides the data-driven clarity businesses need to scale profitably and stay ahead of competitors.
- Enhancing Customer Acquisition and Retention: Helps you see which channels bring in high-value customers. This ensures marketing dollars are spent on strategies that attract and retain long-term buyers.
- Identifying Profitable Products and Channels: Reveals bestsellers, underperformers, and high-margin items, along with the sales channels that deliver the best ROI. This insight allows businesses to prioritize inventory and campaigns that drive the highest profitability.
- Reducing Cart Abandonment and Improving Conversions: Uncovers friction points in the checkout process, whether it’s unexpected shipping costs, complicated forms, or payment issues, so you can fix them and boost conversions.
- Driving Personalized Shopping Experiences: Powers recommendation engines, tailored promotions, and customized content, ensuring every interaction feels relevant.
Also Read: Predictive Analytics in Ecommerce: Boosting Sales and Growth
Ecommerce Analytics Framework/Process
Implementing ecommerce analytics requires a structured approach. The goal isn’t just collecting data, but turning it into actionable insights that improve business performance.
A proven six-step framework looks like this:

- Collect: Gather raw data from all sources, including website interactions, marketing campaigns, sales transactions, customer support, and supply chain systems.
- Integrate: Bring this data together into a unified platform (data warehouse, CRM, or analytics tool) to eliminate silos and ensure accuracy.
- Analyze: Apply statistical methods, segmentation, and attribution modeling to uncover patterns, trends, and problem areas.
- Visualize: Present findings in dashboards, charts, and reports, making complex data easy to understand for decision-makers across teams.
- Act: Use insights to implement changes, optimize product pages, tweak pricing, adjust campaigns, or improve logistics.
- Optimize: Continuously test and refine strategies, learning from results to drive long-term performance improvement.
This process ensures businesses not only collect data but also apply it effectively to fuel growth.
Real-World Examples / Case Studies
- Amazon: Uses predictive analytics and AI-driven recommendation engines to suggest products. By analyzing customer browsing and purchase history, Amazon personalizes experiences at scale.
- Shopify Stores: Many small and mid-sized businesses on Shopify use built-in analytics dashboards to track sales funnels, top-performing products, and customer segments. Insights help them refine ad spend and launch targeted loyalty programs.
- INSIA Example: A fashion retailer using INSIA integrated sales, marketing, and customer data into a single dashboard. By analyzing repeat purchase patterns, they identified high-value customers and launched tailored campaigns, resulting in uplifted retention rates within three months.
Core Metrics in Ecommerce Analytics
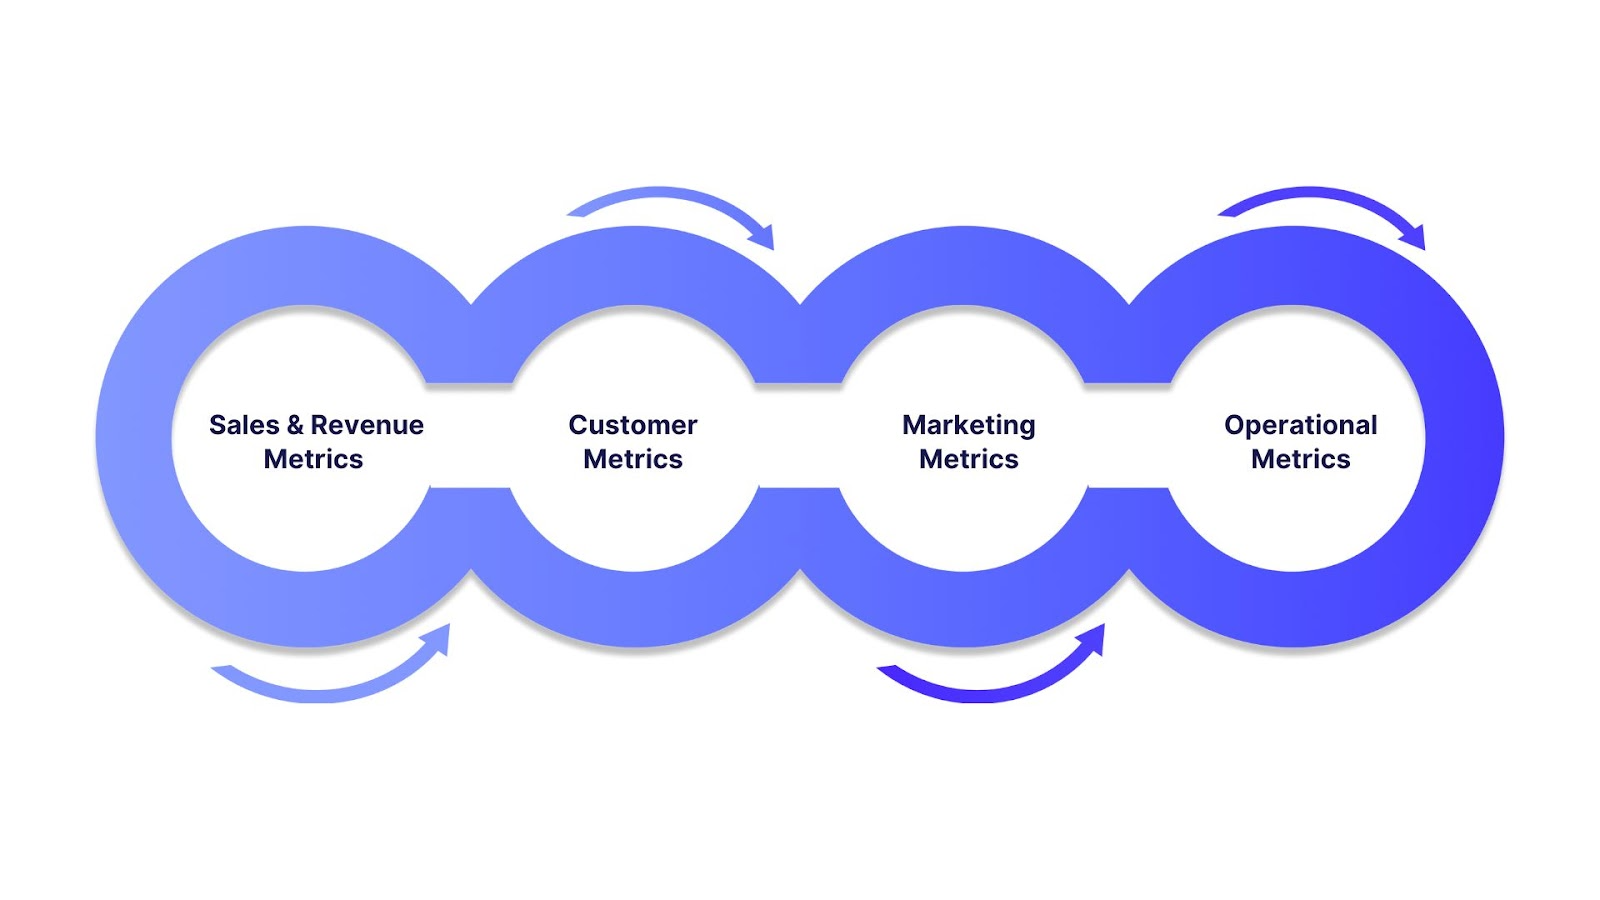
To make informed decisions, ecommerce businesses must track the right metrics across sales, customer behavior, marketing, and operations. These metrics provide a complete view of performance and highlight areas for optimization.
1. Sales & Revenue Metrics
- Average Order Value (AOV): Measures the average spend per transaction, helping identify opportunities for upselling and cross-selling.
- Revenue per Visitor (RPV): Tracks how much revenue is generated on average from each site visitor, combining traffic and conversion performance.
- Gross Margin: Indicates profitability by subtracting the Cost Of Goods Sold (COGS) from revenue, essential for pricing and cost control strategies.
2. Customer Metrics
- Customer Lifetime Value (CLV): Predicts the total revenue a business can expect from a single customer over time. A critical measure for retention and loyalty initiatives.
- Customer Acquisition Cost (CAC): Calculates the average cost of acquiring a new customer across all marketing channels. Comparing CAC to CLV shows long-term profitability.
- Repeat Purchase Rate: Percentage of customers who make multiple purchases, a strong indicator of satisfaction and loyalty.
3. Marketing Metrics
- Conversion Rate (CR): Percentage of visitors completing a purchase, highlighting how effectively the store turns traffic into sales.
- Click-Through Rate (CTR): Measures engagement with ads, emails, or product recommendations, showing how compelling marketing content is.
- Return on Ad Spend (ROAS): Evaluates revenue earned for every dollar spent on advertising, helping prioritize high-performing campaigns.
4. Operational Metrics
- Fulfillment Accuracy: Tracks the percentage of orders shipped correctly and on time, reflecting operational efficiency.
- Return Rates: Monitors the proportion of products returned, which can indicate issues with quality, sizing, or product descriptions.
Together, these metrics provide a 360-degree view of business health, enabling leaders to balance growth, profitability, and customer satisfaction.
Also Read: Understanding Customer Analytics and Its Importance
Types of Ecommerce Analytics
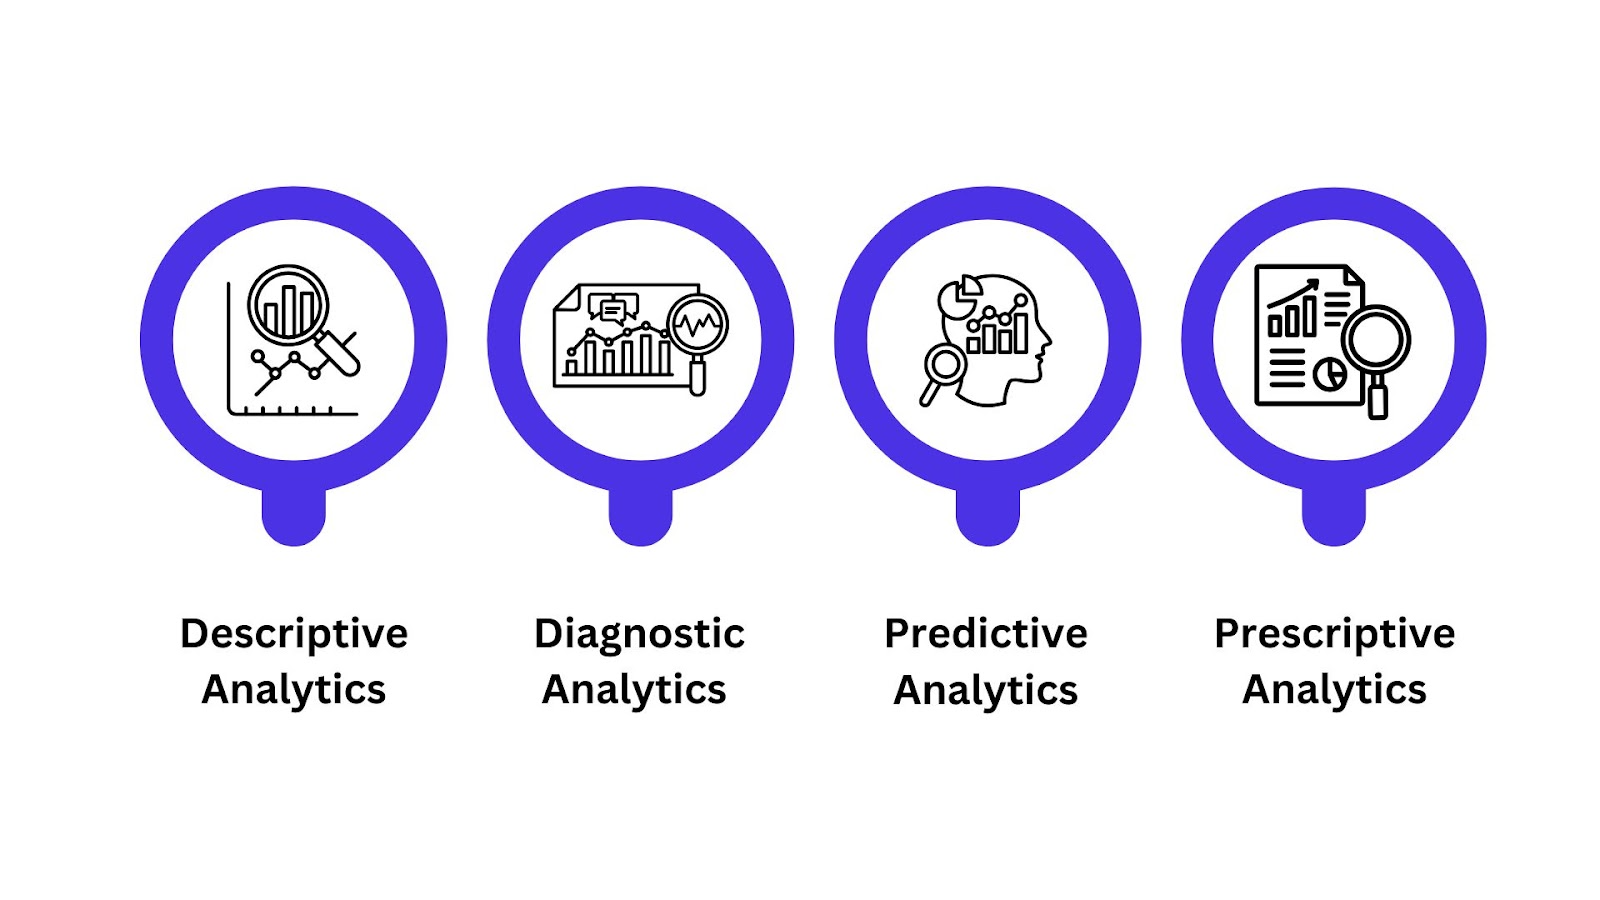
Ecommerce analytics is about understanding the story behind numbers and using that knowledge to guide business strategy. Broadly, analytics can be divided into four types, each answering a different kind of question:
1. Descriptive Analytics – What happened?
This involves summarizing historical data to provide a clear picture of past performance. Common examples include website traffic, revenue trends, cart abandonment rates, and customer churn. It helps businesses monitor KPIs and identify patterns.
Example: Tracking last month’s sales to see which product categories performed best.
2. Diagnostic Analytics – Why did it happen?
Goes a step deeper to uncover the reasons behind performance. Techniques like funnel analysis, cohort analysis, and attribution modeling help identify root causes of issues such as high bounce rates or declining conversions.
Example: Analyzing a checkout funnel to discover that unexpected shipping costs are driving cart abandonment.
3. Predictive Analytics – What will happen?
Uses machine learning, statistical models, and historical data to forecast future outcomes. This helps businesses anticipate demand, predict customer churn, and prepare inventory accordingly.
Example: Forecasting holiday season sales spikes to ensure adequate stock levels.
4. Prescriptive Analytics – What should we do next?
Focuses on actionable recommendations by combining data with optimization techniques. It suggests specific strategies such as pricing adjustments, targeted promotions, or personalized product recommendations.
Example: Offering personalized discounts to at-risk customers to reduce churn.
Ecommerce Analytics Dashboards
An ecommerce analytics dashboard is a visual command center that turns complex data into actionable insights. A well-designed dashboard enables businesses to monitor performance at a glance, identify trends quickly, and make data-driven decisions efficiently.
Here are some essential key elements of an ecommerce analytics dashboard:
- Sales Funnel: Visualizes the customer journey from landing on the site to completing a purchase. It highlights drop-off points at each stage, helping businesses identify where conversions are lost.
- Customer Acquisition Cost vs. Lifetime Value: Displays the relationship between the cost to acquire a customer and the revenue they generate over time. This ensures marketing strategies are profitable and sustainable.
- Cart Abandonment Trends: Tracks where and why shoppers abandon carts, such as high shipping fees or complicated checkout forms. Identifying patterns allows businesses to optimize the checkout process and increase conversions.
- Marketing ROI Breakdown: Shows revenue generated by each marketing channel or campaign. Metrics like ROAS, CTR, and conversion rates help allocate budgets to the most effective strategies.
By consolidating these elements into a single view, ecommerce dashboards make analytics actionable rather than just informational. Visualizing data not only simplifies decision-making but also allows teams to respond quickly to issues and capitalize on opportunities.
Also Read: How to Leverage Consumer Marketing Analytics Effectively
Role of Customer Journey Analytics
Customer journey analytics provides a holistic view of how shoppers interact with a brand, from their first touchpoint to repeat purchases. By tracking the entire lifecycle, businesses can uncover insights that improve engagement, conversions, and loyalty.
Tracking the Complete Journey
Journey analytics follows customers through every stage:
- First Touch: Initial interaction, such as a social media ad, search engine click, or referral.
- Consideration: Browsing products, reading reviews, or adding items to the cart.
- Purchase: Completing a transaction through checkout.
- Repeat Purchase: Subsequent purchases and ongoing engagement, reflecting loyalty and lifetime value.
This tracking helps identify friction points, optimize conversion paths, and understand time-to-purchase for different customer segments.
Multi-Channel Touchpoints
Modern ecommerce customers interact across multiple channels before making a purchase. Journey analytics connects these touchpoints to provide a full picture of influence and effectiveness:
- Social Media Ads: Build awareness and drive initial traffic.
- Organic Search: Capture intent-driven shoppers actively looking for products.
- Email Campaigns: Nurture leads and encourage repeat purchases.
- Paid Search & Display Ads: Retarget users who showed interest but did not convert.
By mapping interactions across channels, businesses can fine-tune marketing strategies, improve attribution accuracy, and deliver personalized experiences that guide customers smoothly along the path to purchase.
Advanced Techniques in Ecommerce Analytics
Beyond basic reporting, advanced ecommerce analytics techniques provide deeper insights into customer behavior, marketing performance, and product strategies. These approaches help businesses make smarter decisions and drive revenue growth.
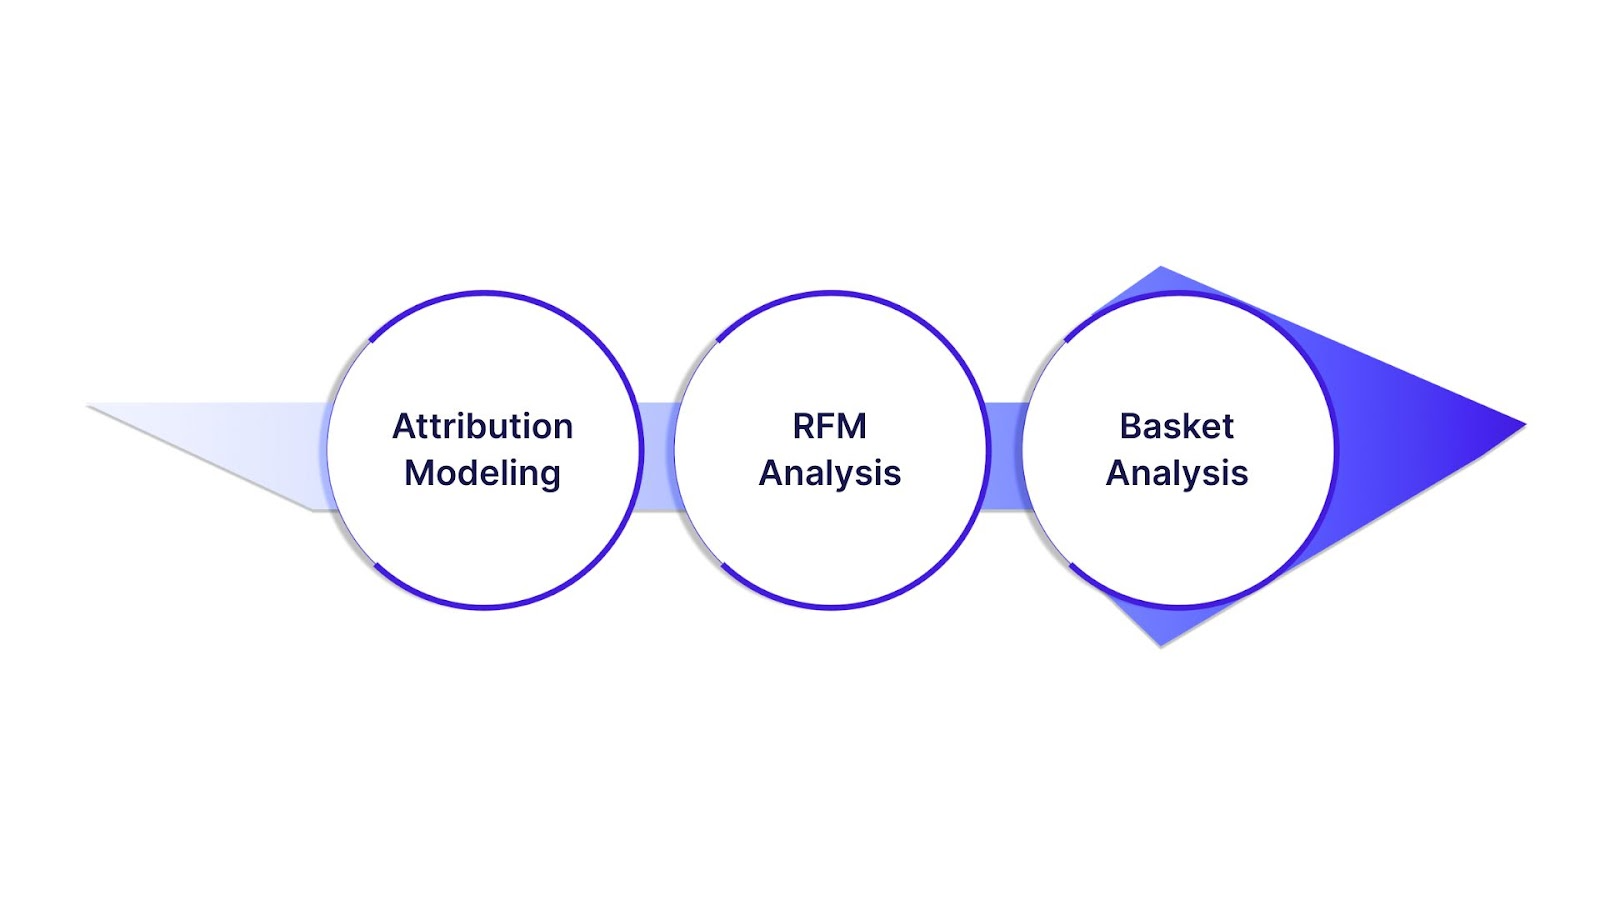
1. Attribution Modeling
Attribution modeling determines how credit for a conversion is assigned across multiple touchpoints in the customer journey. Different models provide different perspectives:
- First-Click Attribution: Gives full credit to the first interaction that introduced the customer to your brand.
- Last-Click Attribution: Assigns all credit to the final interaction before the purchase.
- Multi-Touch Attribution: Distributes credit across all touchpoints, giving a more balanced view of channel performance.
Benefit: Helps optimize marketing spend by identifying which channels and campaigns truly influence conversions.
2. Recency, Frequency, Monetary Value (RFM) Analysis
RFM analysis segments customers based on their purchasing behavior:
- Recency: How recently a customer made a purchase.
- Frequency: How often they buy.
- Monetary Value: How much they spend.
Benefit: Identifies high-value, loyal customers and those at risk of churn, enabling targeted retention campaigns and personalized marketing.
3. Basket Analysis
Also called market basket analysis, this technique examines products that are frequently purchased together.
- Applications:
- Suggest complementary products for upselling and cross-selling.
- Optimize product bundles and promotions.
- Enhance recommendation engines.
Benefit: Increases average order value while providing a more personalized shopping experience.
Together, these advanced techniques allow ecommerce businesses to understand customer behavior more deeply, improve marketing efficiency, and boost sales through smarter merchandising strategies.
Also Read: Guide to Effective SaaS Data Management Strategies
Best Practices for Ecommerce Analytics Success
Collecting data is only the first step. Turning it into actionable insights requires a disciplined approach. The following best practices help ecommerce businesses maximize the value of their analytics efforts:
- Ensure Clean and Accurate Data: Regularly audit data sources to remove duplicates, fix tracking errors, and standardize metrics. Clean, accurate data prevents misinformed decisions and ensures consistency across reports.
- Automate Reporting: Automating dashboards and recurring reports allows teams to focus on insight and strategy rather than data collection.
- Involve Cross-Functional Teams: Marketing, sales, operations, and product teams all benefit from insights and should have visibility into performance metrics. Collaboration ensures decisions are aligned across the organization and act on the same data.
- Continuously Test and Optimize: Use A/B testing, conversion rate optimization, and campaign experiments to identify what works. Analytics should guide continuous refinement of strategies, from pricing and promotions to website UX.
Tools for Ecommerce Analytics
Ecommerce businesses rely on a mix of platform-native dashboards, analytics suites, and advanced business intelligence systems to track performance and guide decisions.
1. INSIA
INSIA is an AI-powered, no-code analytics platform designed to simplify data analysis for businesses. It enables users to connect, clean, transform, analyze, and visualize data from various sources, providing actionable insights without requiring technical expertise.
Key Features:
- AI-Powered Predictive Analytics: Uses machine learning to forecast customer behavior, demand, and pricing trends, enhancing decision-making.
- No-Code, Self-Serve Interface: Empowers non-technical users to create dashboards and reports independently, reducing reliance on IT teams.
- Real-Time Data Integration: Connects with over 30 data sources, providing a unified, real-time view of business metrics.
- Automated Reporting & Alerts: Generates reports and sets up alerts automatically, ensuring timely insights and proactive decision-making.
2. Google Analytics 4 (GA4)
Google Analytics 4 (GA4) is Google's next-generation analytics platform, designed to provide a comprehensive view of user interactions across websites and apps. Unlike its predecessor, GA4 uses an event-based data model, offering enhanced flexibility and deeper insights into customer behavior.
Key Features:
- Event-Based Data Model: Tracks user interactions as discrete events, allowing for more granular data collection and analysis.
- Cross-Platform Tracking: Unifies data from websites and mobile apps, providing a holistic view of the customer journey.
- Enhanced Privacy Controls: Offers features like cookieless measurement and behavioral modeling to comply with global privacy regulations.
3. Shopify Analytics Dashboards
Shopify Analytics empowers ecommerce businesses with comprehensive tools to monitor and enhance performance. It offers real-time insights into sales, customer behavior, and marketing effectiveness, enabling data-driven decisions to drive growth.
Key Features:
- Real-Time Reporting: Monitors live sales, customer activity, and traffic sources, facilitating immediate responses to trends and opportunities.
- Customizable Dashboards: Tailor reports using the ShopifyQL query editor to focus on specific metrics and dimensions relevant to your business.
- Multi-Store Analytics (Shopify Plus): Aggregates data across multiple stores, providing a unified view of performance for organizations with diverse operations.
4. Tableau
Tableau is a leading visual analytics platform that empowers individuals and organizations to explore, analyze, and share data insights. By transforming raw data into interactive and intuitive visualizations, Tableau enables data-driven decision-making across various industries.
Key Features:
- Interactive Dashboards: Creates dynamic dashboards that allow users to drill down into data, facilitating deeper insights and informed decision-making.
- Data Connectivity: Connects to a wide range of data sources, including spreadsheets, databases, and cloud services, ensuring comprehensive data analysis.
- Advanced Analytics: Uses built-in statistical tools and predictive modeling to uncover trends and forecast future outcomes.
Also Read: What Is SaaS Data Security? Best Practices & Challenges
Key Strategies for Effective Ecommerce Analytics
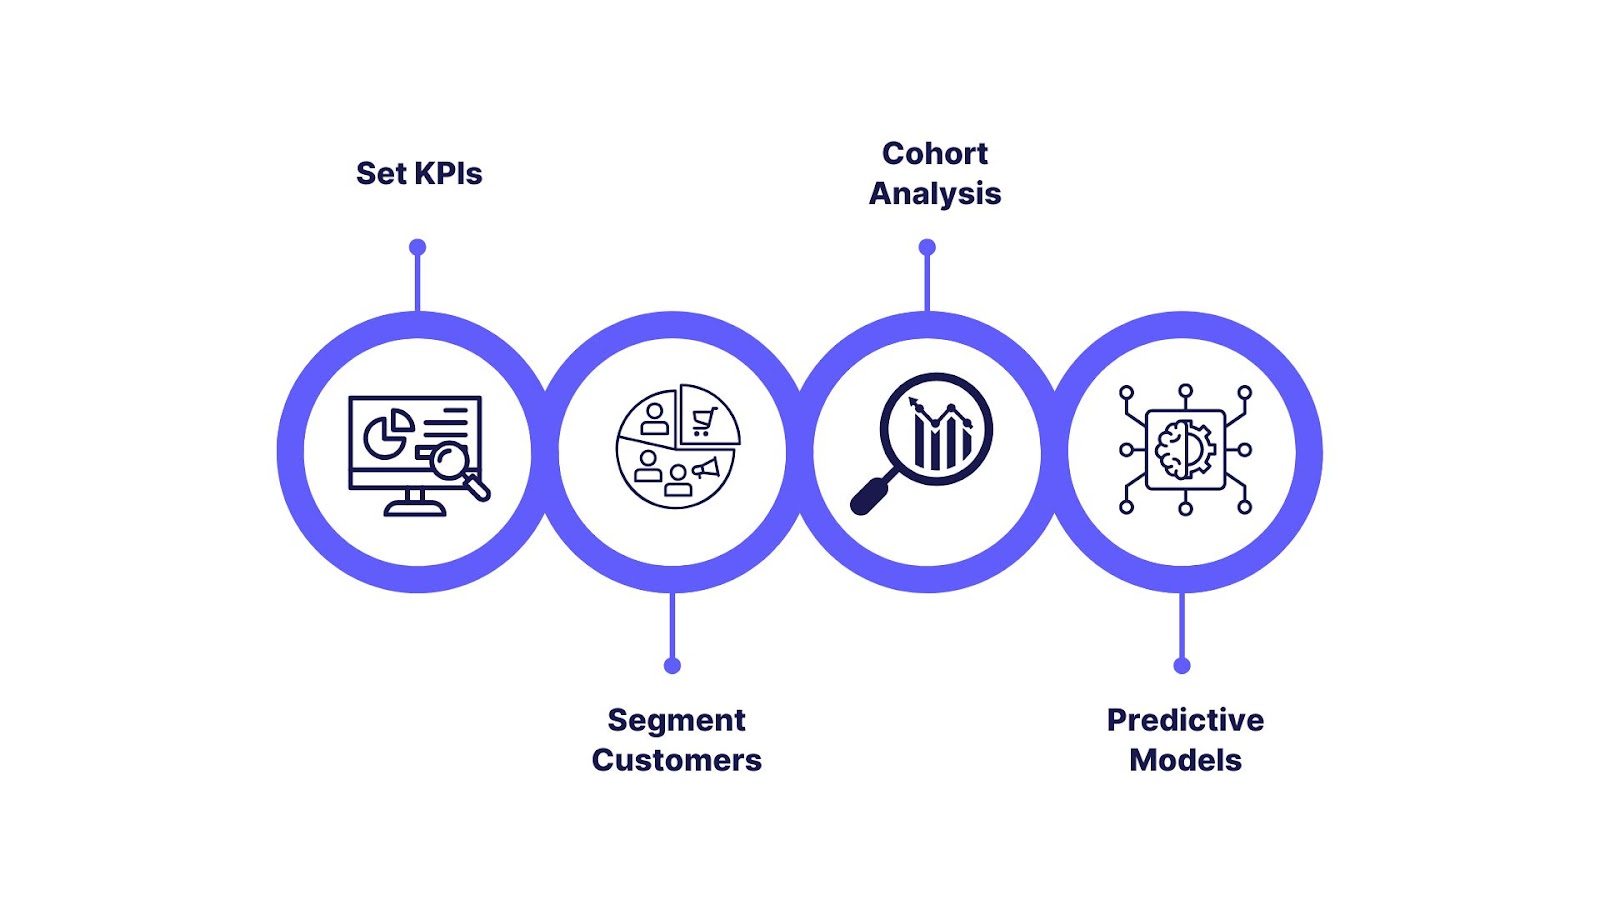
Collecting data is just the beginning. To turn analytics into actionable insights and measurable results, ecommerce businesses need a strategic approach. The following strategies ensure analytics drives meaningful outcomes:
- Set Clear KPIs Aligned with Business Goals: Identify KPIs that directly support your objectives, whether it’s increasing revenue, boosting retention, or improving marketing ROI.
- Segment Customers for Deeper Insights: Segmenting by demographics, purchase behavior, or engagement levels reveals patterns hidden in averages.
- Use Cohort Analysis for Retention Trends: Cohort analysis groups customers based on shared characteristics, such as the date of their first purchase. Tracking these cohorts over time highlights retention trends and helps businesses understand the long-term value of different customer segments.
- Use Predictive Models for Inventory and Demand Planning: Predictive analytics anticipates future customer behavior, such as demand spikes or potential churn. This enables businesses to optimize inventory, plan campaigns, and reduce stockouts or overstock situations, ensuring products are available when customers want them.
Common Challenges in Ecommerce Analytics
While ecommerce analytics offers tremendous opportunities, businesses often face obstacles that can limit the effectiveness of their data initiatives. Understanding these challenges is the first step toward overcoming them.
- Data Silos and Integration Issues: Many businesses collect data across multiple platforms. Without proper integration, this data remains siloed, making it difficult to get a unified view of performance.
- Tracking Customer Journeys Across Multiple Channels: Modern shoppers interact with brands via social media, paid ads, organic search, email, and more. Capturing the full customer journey across these channels is complex, and incomplete tracking can lead to misattribution of conversions and ineffective marketing strategies.
- Interpreting Large Volumes of Data Effectively: Ecommerce businesses generate enormous amounts of data daily. Without the right analytics tools and expertise, it’s challenging to extract actionable insights from this volume, often leading to decision paralysis or misguided strategies.
- Maintaining Data Privacy and Compliance: With regulations like GDPR, CCPA, and other global data privacy laws, businesses must ensure secure collection, storage, and usage of customer data. Non-compliance can result in hefty fines and damage to brand reputation.
Future of Ecommerce Analytics
The ecommerce is evolving rapidly, and analytics is at the forefront of this transformation. Emerging technologies and shifting consumer expectations are shaping the next generation of insights-driven strategies.
- AI-Driven Personalization and Recommendation Engines: By analyzing customer behavior, preferences, and purchase history, AI-powered recommendation engines can suggest products tailored to individual shoppers, increasing conversions and loyalty.
- Real-Time Analytics with IoT and Automation: With the rise of Internet of Things (IoT) devices and automated systems, businesses can collect and analyze data in real time. This enables immediate responses to customer behavior, such as dynamic pricing, instant inventory updates, and personalized messaging at the point of engagement.
- Greater Reliance on Predictive Models: By anticipating trends, businesses can optimize stock levels, reduce waste, and ensure products are available when customers want them.
- Privacy-First Analytics in a Cookieless World: As third-party cookies phase out and privacy regulations tighten, ecommerce analytics will need to prioritize first-party data and privacy-compliant tracking. Brands that adapt will be able to maintain personalized experiences while safeguarding customer trust.
Conclusion
In today’s competitive online marketplace, data is more than just numbers. It is a strategic advantage. Companies that use analytics effectively can anticipate customer needs, personalize shopping experiences, and make smarter, faster decisions than their competitors.
Take action now and implement robust ecommerce analytics strategies and adopt tools like INSIA to turn your data into actionable insights. The sooner you embrace a data-driven approach, the faster your business can unlock growth, improve retention, and stay ahead.
Unlock the full potential of your ecommerce data with INSIA. Start turning insights into growth today.