Why CFOs Can't Afford to Ignore Financial Analytics Today
In 2025, data, metrics, and analytics have emerged as the top priority for CFOs globally, overtaking other concerns such as growth and operational efficiency. According to Gartner’s 2025 CFO survey of over 250 finance leaders, analytics and data-driven decision-making are the critical enablers for managing complex risks, driving enterprise growth, and enhancing agility.
CFOs are today’s visionaries who rely on real-time, AI-powered financial analytics to anticipate market shifts, optimize costs, and forecast growth with unprecedented accuracy. In fact, 59% of CFOs report actively using predictive analytics, with a 33% increase in forecasting accuracy noted as a direct benefit.
Key Reasons Financial Analytics Is Non-Negotiable for CFOs:
- Real-Time Decision Making: Financial analytics equips CFOs with instant insights into cash flow and profitability, enabling agile responses to market changes.
- Proactive Risk Management: Advanced predictive models help CFOs identify and mitigate credit, market, and operational risks before they escalate.
- Enhanced Financial Performance: Analytics reveals cost inefficiencies and optimizes resource allocation, boosting overall financial health.
- Automated Compliance: Automated reporting reduces manual effort, ensures regulatory adherence, and minimizes risk of penalties.
- Competitive Strategic Advantage: By using data-driven insights, CFOs can drive growth initiatives and outpace competitors in a volatile market.
At a Glance
- Financial analytics helps CFOs make data-driven decisions, boosting profitability and reducing risks across industries.
- Descriptive, predictive, and prescriptive analytics transform data into insights, guiding future financial actions.
- Real-time dashboards and KPIs enable proactive financial management and quick decision-making.
- AI-powered financial analytics optimizes forecasting, cost control, and ensures business agility and profitability.
What Is Financial Analytics?
Financial analytics is the process of collecting, integrating, analyzing, and interpreting financial data to guide decision-making and strategic planning throughout an organization.
It includes a broad spectrum of analytical techniques, from descriptive reports of past performance to advanced predictive and prescriptive analytics that forecast trends and recommend actions.
Financial analytics use big data, artificial intelligence (AI), machine learning, and automation technologies to convert raw financial information into actionable insights.
This enables organizations to react swiftly to market changes, optimize resource allocation, and enhance financial management.
Types and Methods of Financial Analytics
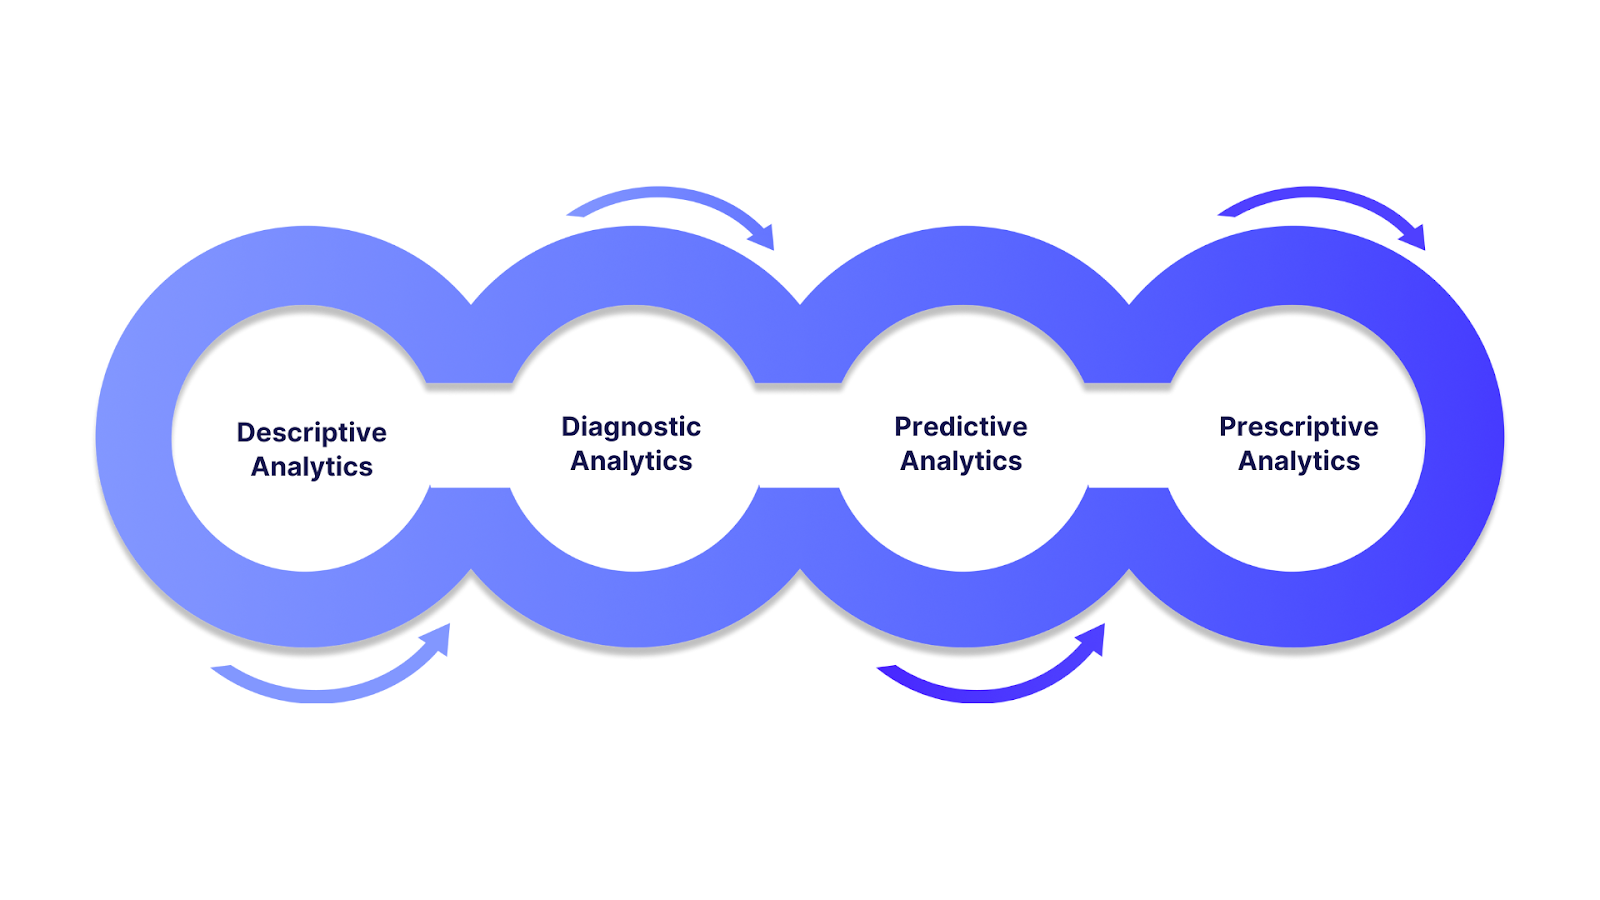
Financial analytics encompasses several distinct types of analysis, each serving unique purposes to turn data into actionable business insights. Understanding these categories helps organizations apply the appropriate methodology for different financial questions and challenges.
1. Descriptive Analytics
Descriptive analytics focuses on examining historical financial data to understand what has happened within an organization’s financial landscape. This method aggregates and summarizes data such as revenue, expenses, cash flows, and key performance indicators (KPIs) to identify trends and patterns over a defined period. Common tools include financial statements, dashboards, and reports.
2. Diagnostic Analytics
Going a step further, diagnostic analytics evaluates the underlying causes of financial trends or anomalies identified in descriptive analysis. This involves drilling down into transaction details, cost drivers, and variances to discover why revenue fell short or expenses spiked.
3. Predictive Analytics
Predictive analytics uses historical financial and operational data combined with statistical techniques, machine learning, and AI to forecast future financial outcomes. It enables finance leaders to anticipate trends in revenues, cash flow, expenses, and risks.
Applications include demand forecasting, credit risk assessment, budget projections, and scenario simulations that consider external factors like market fluctuations or regulatory changes.
4. Prescriptive Analytics
Prescriptive analytics builds on predictive insights by recommending specific actions to optimize financial performance.This advanced methodology employs algorithms, optimization models, and AI.
These tools suggest the best courses of action under various scenarios, such as cost reduction strategies, capital allocation adjustments, or risk mitigation plans.
Summary Table:
| Type of Analytics | Purpose | Typical Use Cases |
|---|---|---|
| Descriptive Analytics | Understand historical financial trends | Financial reporting, KPI dashboards, trend analysis |
| Diagnostic Analytics | Identify causes of financial issues | Variance analysis, root cause identification |
| Predictive Analytics | Forecast future financial performance | Budget forecasting, risk prediction, scenario modeling |
| Prescriptive Analytics | Recommend actionable decisions | Cost optimization, investment planning, operational adjustments |
Building on these foundational types of financial analytics, it's essential to explore how they can be applied in specific areas to track and enhance overall business performance.
Let’s get into the core financial analytics that every organization must monitor to drive effective decision-making and sustained growth.
Also Read: What is Sales Analytics? Key Metrics Explained
Core Financial Analytics To Track Track Business Performance
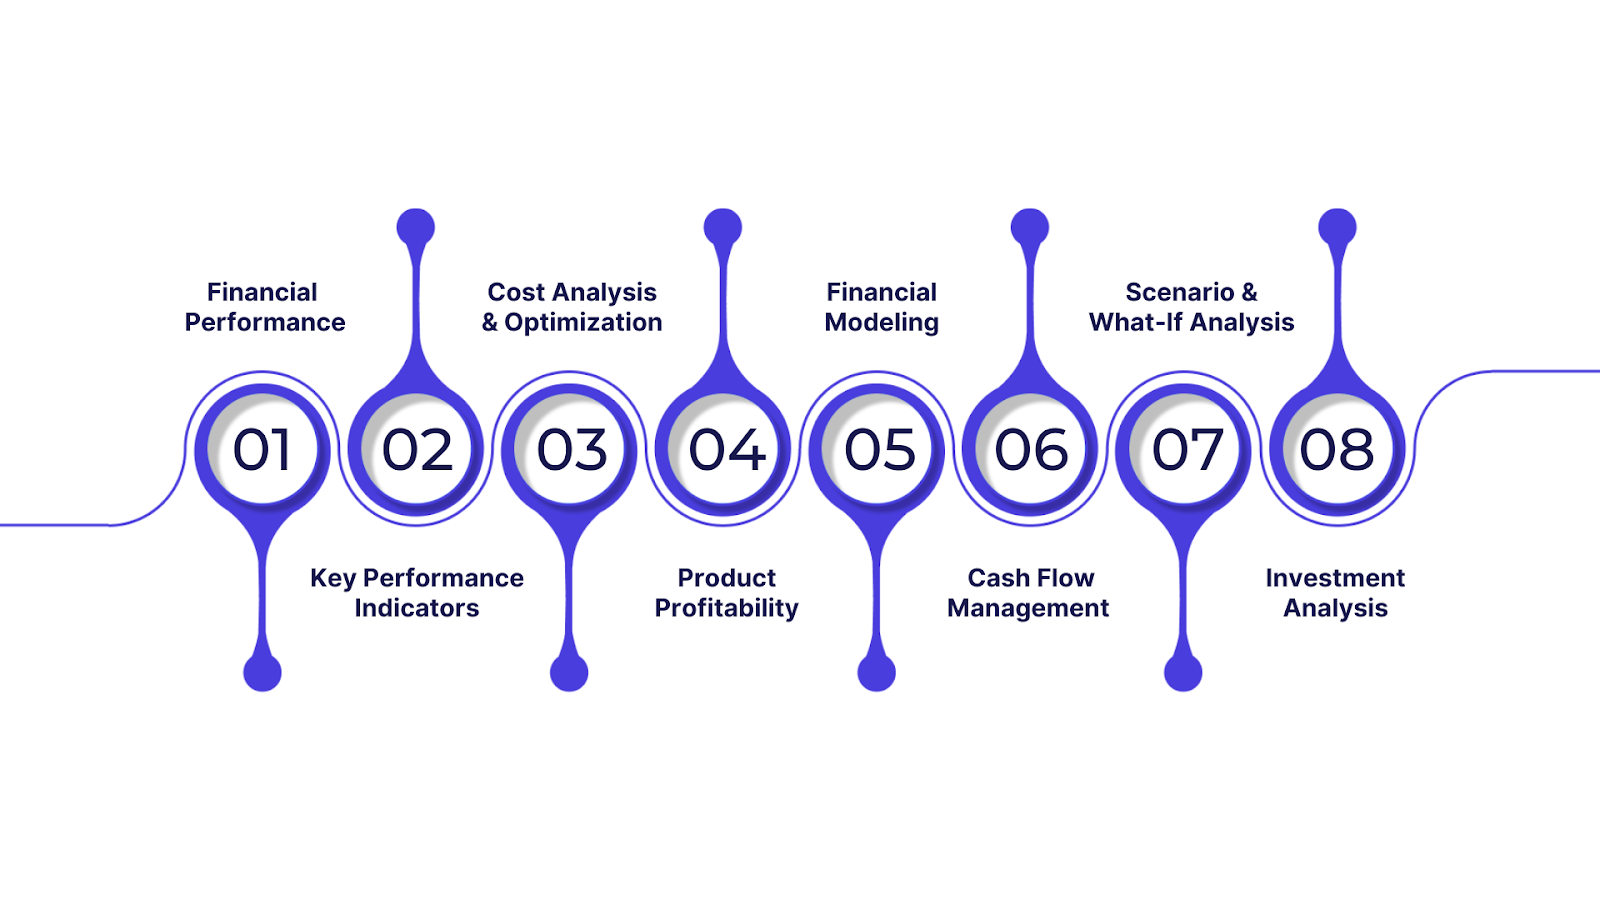
Financial analytics covers a broad spectrum of focus areas, each crucial for understanding and improving an organization’s financial health and decision-making. Below, we outline the core areas that finance teams must know to achieve the full value of their financial data.
1. Financial Performance Analysis
Financial performance analysis centers on assessing how well an organization generates revenues, manages expenses, and ultimately achieves profitability. It provides insights into operational effectiveness and financial sustainability by transforming raw financial data into actionable intelligence.
Overview of Revenue, Expense, and Profitability Analysis
- Revenue Analysis: Examines all income streams to understand growth drivers, seasonality, and revenue concentration risks. It includes evaluating sales performance across products, regions, or customer segments.
- Expense Analysis: Breaks down costs into categories such as operational expenses, cost of goods sold (COGS), and overheads to identify spending patterns and control leaks.
- Profitability Analysis: Measures gross profit, operating profit, and net profit margins, providing clarity on the efficiency of revenue generation relative to expenses.
Importance of Ratio Analysis for Business Health Assessment
Ratio analysis complements basic profit/loss evaluation by benchmarking operational and financial health through standardized indicators:
| Ratio Type | Purpose | Examples |
|---|---|---|
| Liquidity Ratios | Assess the company’s ability to meet short-term obligations | Current ratio, Quick ratio |
| Profitability Ratios | Evaluate ability to generate profit relative to revenue and assets | Net profit margin, Return on equity (ROE) |
| Efficiency Ratios | Measure utilization of assets and resources for revenue generation | Asset turnover, Inventory turnover |
2. Key Performance Indicators (KPIs) Monitoring
KPIs are quantifiable financial and operational metrics that reflect the performance of the business against strategic and operational goals. Monitoring the right KPIs enables proactive management and early intervention to drive financial success.
Critical KPIs commonly used by finance leaders include:
- EBITDA (Earnings Before Interest, Taxes, Depreciation, and Amortization): Measures operational profitability excluding non-operational costs and accounting policies.
- Operating Cash Flow: Represents cash generated from core business operations, indicating liquidity health.
- Return on Equity (ROE): Gauges profitability relative to shareholders’ equity.
- Debt Ratios: Including debt-to-equity and interest coverage ratios, these measure leverage and financial risk.
Real-Time KPI Tracking Through Dashboards for Proactive Management
- Modern financial analytics platforms provide live dashboards that update KPIs continuously.
- Alerts and thresholds enable finance teams to respond swiftly to deviations.
- Visualization using charts and heatmaps simplifies complex data, making it accessible to executives and operational teams alike.
Connection Between KPIs and Organizational Strategic Goals
KPIs must be aligned with broader company objectives, linking financial management with growth, cost control, risk appetite, and investment priorities.
For example, a company pursuing aggressive growth may prioritize revenue and cash flow KPIs, while a more mature business might focus on profitability and cost efficiency metrics.
Regular review of KPIs ensures that financial strategies remain relevant and integrated with operational realities.
3. Cost Analysis and Optimization
Cost analysis is a critical discipline that enables organizations to understand spending patterns and identify opportunities to control expenses without impairing operational effectiveness.
To effectively analyze costs, it is important to distinguish between different types:
| Cost Category | Description | Example |
|---|---|---|
| Fixed Costs | Expenses that remain constant regardless of production or sales volumes | Rent, salaries, insurance |
| Variable Costs | Expenses fluctuating directly with production/sales levels | Raw materials, commissions |
| Direct Costs | Costs directly attributable to the production of a specific product or service | Raw materials, direct labor |
| Indirect Costs | Overhead expenses not directly tied to a product but necessary for operations | Utilities, administrative salaries |
Identifying Inefficiencies and Opportunities for Cost Savings
- Detailed expense tracking can reveal wasteful spending areas, such as excessive procurement costs or overcapacity in staffing.
- Benchmarking against industry standards highlights underperformance.
- Cross-functional collaboration ensures that cost optimization initiatives do not compromise quality or customer satisfaction.
4. Customer and Product Profitability Segmentation
Understanding profitability at a granular level by customer segment and product line is essential for optimizing revenue streams and strategic resource allocation. This focus area helps organizations identify which customers and products drive the most value and where improvements or strategic pivots are necessary.
Key Components
- Customer Segmentation: Analyze revenue, costs, and profitability by customer groups, considering lifetime value (CLV), purchase frequency, and behavior patterns.
- Product Line Analysis: Evaluate each product or service’s profitability by factoring in direct costs, overhead allocation, and sales volumes to determine contribution margins.
- Strategic Application: Use segmentation insights to tailor marketing campaigns, refine pricing strategies, and prioritize investments in high-margin customers or products.
- Avoiding Profit Dilution: Identify low-margin or loss-leading segments for cost control, renegotiation, or discontinuation.
Business Benefits
- Enhances sales and marketing ROI by targeting profitable customer segments.
- Supports product portfolio management to focus on high-margin offerings.
- Elevates decision-making with data-backed insights on profitability drivers.
5. Budgeting, Forecasting, and Financial Modeling
Accurate financial planning is pivotal for organizational resilience and growth. This area leverages historical data combined with predictive analytics to produce adaptive budgets and forecasts that respond dynamically to business conditions.
Core Elements
- Budgeting: Develop detailed financial plans that allocate resources aligned with company strategy and anticipated operational needs.
- Financial Forecasting: Use both quantitative models and qualitative inputs to predict future revenues, expenses, cash flows, and capital needs.
- Role of AI and Machine Learning: Integrate AI-driven tools to improve forecast accuracy, reducing reliance on manual assumptions and cutting forecast errors significantly.
Advantages
- Improves financial agility by enabling rapid response to changing market conditions.
- Increases budgeting accuracy through data-driven insights.
- Facilitates alignment between financial expectations and operational performance.
6. Cash Flow Management and Analysis
Maintaining healthy cash flow is vital to sustain operations, fund growth, and meet obligations. This analytical area focuses on monitoring liquidity and optimizing working capital through comprehensive insights into cash inflows and outflows.
Key Focus Areas
- Cash Flow Tracking: Monitor day-to-day cash movements to ensure liquidity and solvency.
- Forecasting Liquidity Needs: Predict future cash positions under different operational scenarios to pre-empt shortages.
- Working Capital Optimization: Analyze and manage receivables, payables, and inventory to improve cash conversion cycles.
- Risk Mitigation: Identify timing mismatches in cash flows that could trigger short-term liquidity crises.
Practical Impact
- Prevents cash crunches by maintaining adequate liquidity buffers.
- Reduces financing costs through efficient working capital management.
- Supports strategic investments and timely debt repayment with optimized cash availability.
7. Scenario and What-If Analysis
Scenario and what-if analysis is a vital financial analytics tool that enables organizations to model multiple hypothetical future conditions and assess their potential impact on financial performance. This approach supports robust risk management and strategic planning by preparing decision-makers for uncertainty.
Key Components
- Scenario Analysis: Evaluates a range of plausible future events such as market downturns, regulatory changes, or shifts in consumer demand. This type of analysis helps quantify possible financial outcomes under different conditions.
- What-If Analysis: Focuses on specific variable changes (e.g., price adjustments, cost changes, sales volume fluctuations) to determine their direct effects on revenue, profit, and cash flow.
- Stress Testing: Simulates extreme but possible adverse situations to test organizational resilience and liquidity buffers.
Business Value
- Enhances decision-making agility by anticipating financial risks and opportunities before they occur.
- Supports contingency planning and resource reallocation for mitigating adverse impacts.
- Facilitates communication of potential outcomes to stakeholders, improving transparency and confidence.
Practical Examples
- A CFO might run a what-if analysis to understand how a 10% increase in raw material costs affects profitability margins.
- Scenario analysis could evaluate financial performance under optimistic, pessimistic, and base-case economic environments.
8. Investment Analysis and Portfolio Management
Investment analysis and portfolio management focus on assessing the viability, performance, and risk profile of investments to maximize returns while aligning with the organization’s strategic objectives.
Core Activities
- Investment Appraisal: Analyzing potential projects or assets using metrics like net present value (NPV), internal rate of return (IRR), and payback periods to prioritize capital allocation.
- Portfolio Optimization: Balancing diversification and risk by evaluating correlations among assets and adjusting holdings to improve the overall risk-return profile.
- Performance Monitoring: Tracking investment returns against benchmarks and market conditions using real-time analytics.
- Risk Management: Applying quantitative models and AI-driven insights to detect market and credit risks impacting portfolios.
Strategic Benefits
- Maximizes returns on invested capital by prioritizing high-value, low-risk opportunities.
- Reduces portfolio risk through diversification and advanced optimization techniques.
- Informs timely buy/sell decisions and capital budgeting to adapt to changing market dynamics.
Also Read: Understanding Secondary Sales in Business
Next, we’ll learn the powerful role analytics play beyond traditional number crunching.
Business Impact of Financial Analytics
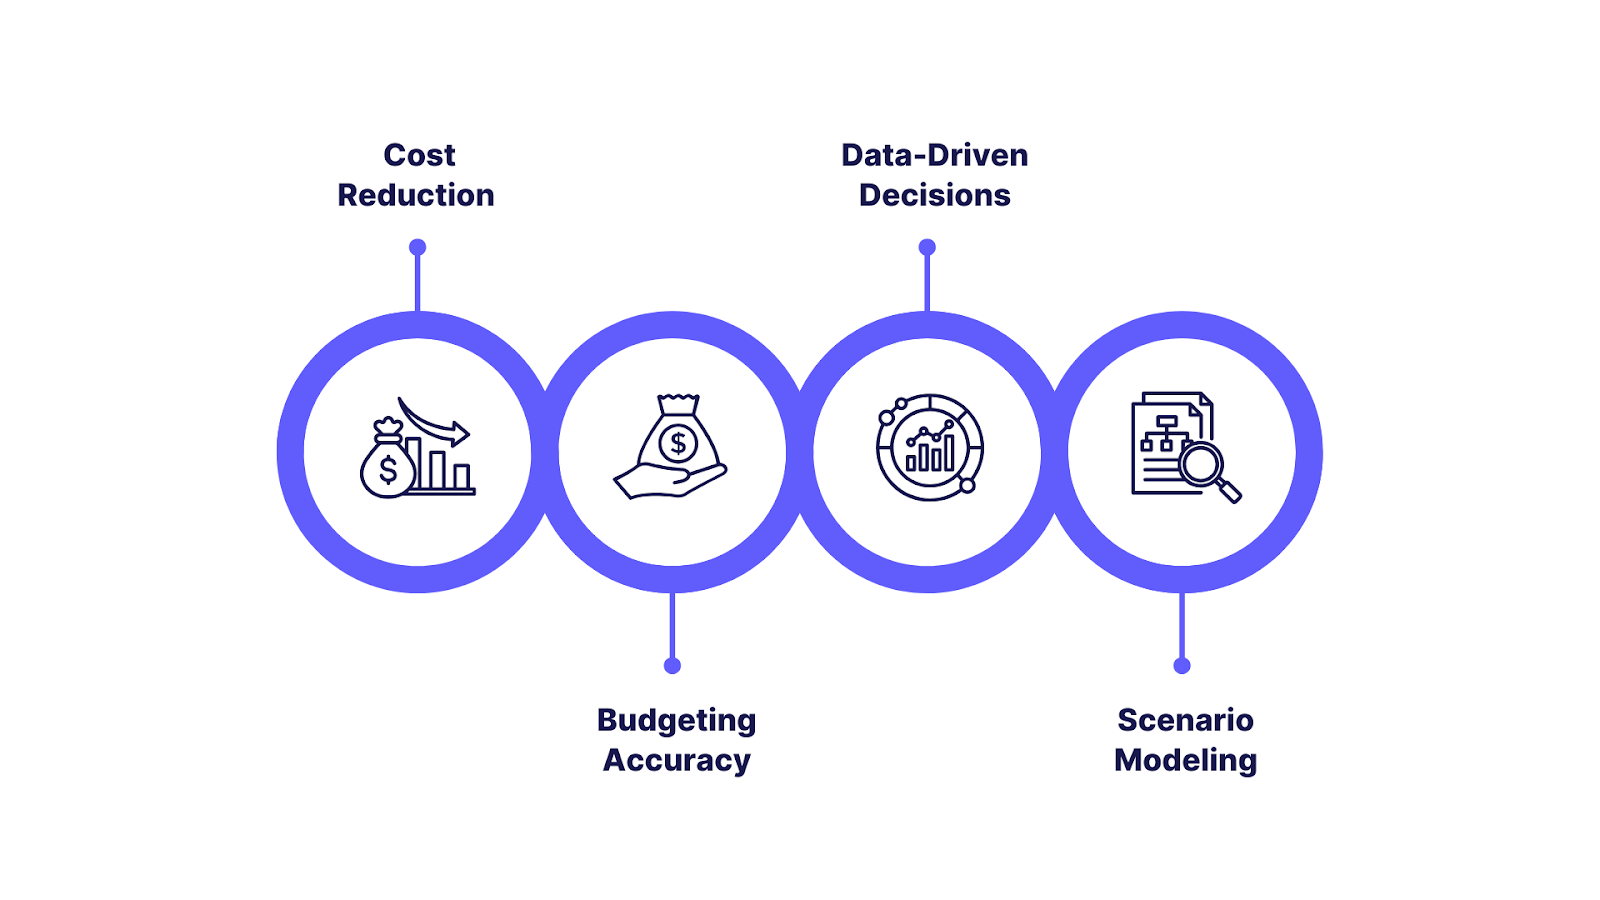
Understanding the tangible value financial analytics delivers is crucial for transforming data into strategic advantage. This section explores how financial insights can drive measurable improvements in cost management, budgeting accuracy, ROI, and major investment decisions.
1. Cost Reduction Through Predictive Insights
Financial analytics uses historical data and predictive models to identify cost drivers and inefficiencies proactively. By forecasting trends and potential issues, organizations can optimize resource allocation, reduce waste, and streamline expenses.
- Predictive analytics alerts finance teams to anticipated cost overruns or inefficiencies before they materialize, enabling timely corrective actions.
- Cost optimization initiatives informed by analytics lead to reductions in operational and procurement expenses.
- Example: Companies using financial analytics have reported cost savings of up to 15% by identifying redundant spending and optimizing supplier contracts and staffing levels.
2. Improved Budgeting Accuracy
Traditional budgeting often relies on static assumptions that can quickly become outdated. Financial analytics integrates real-time data and AI-driven forecasting models to create dynamic budgets that adjust to changing conditions.
- Advanced forecasting improves accuracy by incorporating internal performance metrics and external market signals.
- Scenario and what-if modeling allow finance teams to test assumptions and prepare for multiple outcomes, reducing budget variances.
- Enhanced budgeting precision facilitates better planning, avoids overspending, and aligns resources with strategic priorities.
3. ROI From Data-Driven Decisions
Organizations that embed financial analytics into decision-making see improved returns on strategic investments and operational initiatives.
- Analytics-driven insights help spot high-value growth opportunities and optimize pricing, marketing, and investment strategies.
- Customer and product profitability analysis guides resource prioritization, elevating ROI by focusing on high-margin segments.
- Data-backed decision-making reduces reliance on intuition and ensures decisions align with measurable financial outcomes.
4. Scenario Modeling for M&A or CapEx Decisions
Financial analytics tools enable companies to run detailed scenario analyses for complex business decisions such as mergers, acquisitions, or major capital expenditures.
- Scenario and what-if modules simulate the financial impact of different deal structures, market conditions, and integration strategies.
- Investment analysis models evaluate risks and returns, supporting precise capital allocation.
- This data-driven approach mitigates risks, improves deal outcomes, and strengthens strategic planning capabilities.
As organizations use financial analytics to optimize performance and drive growth, it's equally important to focus on managing risks and ensuring compliance. Let’s now explore how financial analytics can transform risk management and compliance practices.
Risk and Compliance in Financial Analytics
Managing risks and ensuring regulatory compliance are crucial pillars for sustaining organizational resilience and stakeholder confidence. Financial analytics plays a transformative role in evolving risk and compliance management from reactive processes to proactive, data-driven strategies.
Risk Management Framework
A robust risk management framework integrates financial analytics into an enterprise-wide approach that identifies, assesses, monitors, and mitigates risks effectively.
- Structured Processes: Define clear risk policies, roles, and responsibilities across governance bodies, risk teams, and operational units to avoid silos.
- Data-Driven Monitoring: Use real-time analytics dashboards for continuous risk assessment and early detection of emerging threats.
- Dynamic Governance: Establish ongoing reviews and adaptive controls to respond to changes in business or regulatory environments.
- Internal Controls Alignment: Embed risk assessment within internal financial controls to ensure accuracy in reporting and operational efficiency.
Managing Core Financial Risks with Analytics
Financial analytics enables in-depth understanding and management of key risk categories critical to financial institutions and corporates alike:
| Financial Risk Type | Analytics Focus | Business Benefits |
|---|---|---|
| Credit Risk |
|
|
| Market Risk |
|
|
| Operational Risk |
|
|
| Liquidity Risk |
|
|
| Legal & Regulatory Risk |
|
|
| Reputational Risk |
|
|
To drive actionable financial insights, businesses need a robust platform that integrates data seamlessly and delivers real-time, AI-powered solutions. This is where INSIA comes in.
Also Read: Boost Your Marketing Wins: 12 Must-Know Metrics for Campaign Success!
Why INSIA Matters in Financial Analytics
In a finance world defined by rapid change, data complexity, and high performance expectations, INSIA stands out as an AI-powered, no-code data analytics platform purpose-built for decision-makers.
INSIA enables finance teams to translate data into actionable insight, equipping organizations to thrive in a landscape where agility and foresight are paramount.
What INSIA Offers: Core Capabilities
- Predictive Analytics & Scenario Modeling
Run powerful forecasts, what-if analyses, and stress tests with just a few clicks. Anticipate risks and opportunities proactively rather than reactively.
- Real-Time KPI Monitoring & Dashboards
Monitor critical financial and operational metrics in real time. INSIA provides unified dashboards for cash flow, performance, and risk, all in one accessible view.
- Cost Optimization & Budgeting Tools
Identify inefficiencies, automate cost tracking, and generate dynamic budgets based on live data. Allocate resources strategically for maximum impact.
- Investment and Portfolio Analytics
Conduct detailed investment appraisals, track returns, and optimize capital allocation leveraging machine learning–driven insights.
- Risk and Compliance Automation
Stay ahead of evolving regulations and internal governance mandates. INSIA streamlines compliance with automated reporting, real-time alerts, and audit-ready transparency.
- Deep Integration & Collaboration
Connect seamlessly with ERP, treasury, CRM, and other critical enterprise systems. Foster real-time collaboration across finance, strategy, and operations teams.
How INSIA Amplifies Financial Analytics
INSIA democratizes analytics, making advanced tools accessible to finance professionals without coding or data science expertise. This empowers organizations to:
- Accelerate decision cycles and respond to new challenges faster.
- Improve forecasting accuracy and risk detection through AI and live data integrations.
- Unlock measurable value by connecting strategic priorities with data-driven execution.
- Drive process automation that frees finance talent to focus on high-value activities.
Learn ore about How INSIA revolutionized Trident's diesel engine services with data-driven insights
Conclusion
As you've seen, financial analytics is not just a tool, it's a game-changer for modern businesses. It's the bridge between raw data and actionable insights, helping you make more informed, timely decisions.
With the power of data science, machine learning, and AI, you're equipped to not only manage risks but also identify opportunities for growth and innovation.
Take the next step towards transforming your financial strategy. Explore how INSIA can empower your organization with advanced financial analytics and help you unlock new growth opportunities.