In 2025, Software as a Service (SaaS) analytics is becoming mission-critical for businesses seeking scalable growth and strong customer retention. The SaaS market is expected to generate $390.5 billion in revenue this year, reflecting rapid adoption and a rising demand for data-driven tools.
Meanwhile, the SaaS-based business analytics market is projected to grow at a Compound Annual Growth Rate (CAGR) of around 14.23% from 2025 to 2032, expanding from approximately $12.09 billion in 2024 to $34.85 billion by 2032.
What’s driving this surge? Businesses are using analytics to:
- Turn raw data into actionable insights that improve performance and efficiency.
- Support long-term customer relationships and recurring revenue by reducing churn and optimizing customer journeys.
- Monitor critical business metrics to make more accurate forecasts and better strategic decisions.
Having said that, in this article, let’s have a look at some of the essential SaaS analytics tools for businesses.
Key Metrics Tracked by SaaS Analytics Tools
SaaS analytics tools provide a clear view of business performance by monitoring both financial health and customer behavior. The following core metrics help organizations measure efficiency, growth, and long-term sustainability:
- Monthly Recurring Revenue (MRR): Tracks recurring revenue earned each month, providing insights into short-term growth trends and forecasting cash flow stability.
- Annual Recurring Revenue (ARR): Expands the view to yearly subscription revenue, helping SaaS businesses assess scalability and long-term financial performance.
- Customer Acquisition Cost (CAC): Measures the total cost of acquiring a new customer, ensuring marketing and sales investments align with revenue growth.
- Churn Rate: Monitors the percentage of customers who cancel subscriptions over a given period, a vital metric for understanding retention challenges.
- Customer Lifetime Value (LTV): Estimates the total revenue a business can expect from a customer over the entire relationship, guiding resource allocation and retention strategies.
- Net Revenue Retention (NRR): Captures revenue retained from existing customers after upgrades, downgrades, and churn. A high NRR signals strong product-market fit and customer loyalty.
- Activation Rate / Product Usage Metrics: Measures how quickly and effectively new users engage with key product features, serving as an early indicator of customer success and adoption.
- Average Revenue Per User (ARPU): Calculates average revenue generated per customer, providing insights into pricing effectiveness and customer value across segments.
Also Read: Guide to Effective SaaS Data Management Strategies
Top 7 SaaS Analytics Tools Available
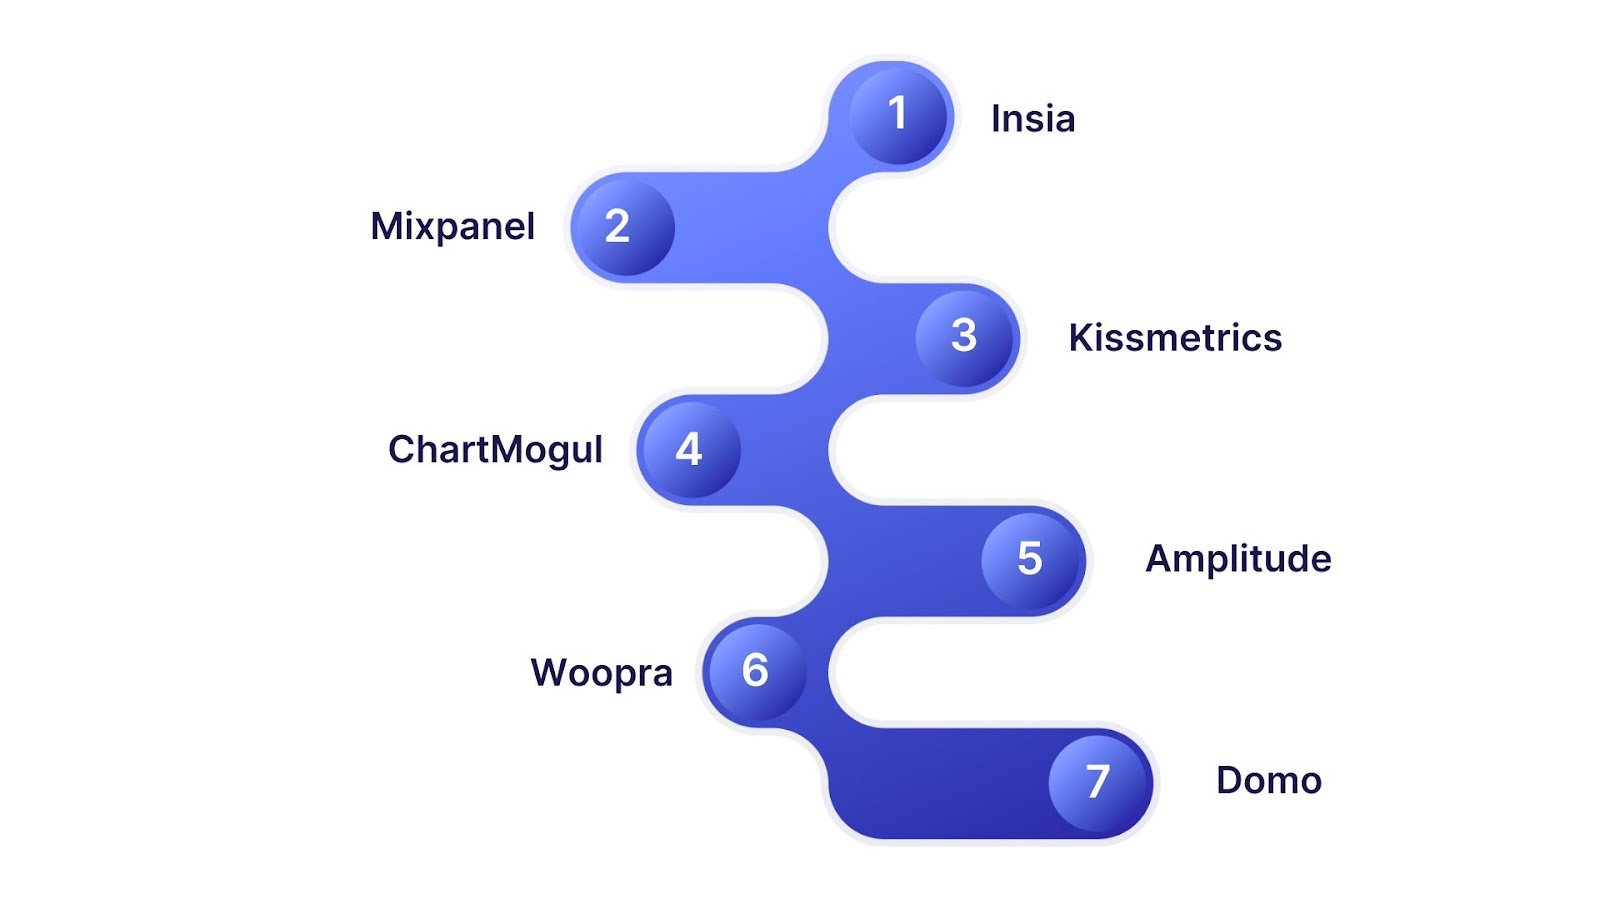
The SaaS analytics market offers a wide range of tools that address financial performance, product usage, customer behavior, and revenue growth. Here is the list of top 7 SaaS analytics tools:
1. INSIA
INSIA is a no-code SaaS analytics platform designed for business teams. It simplifies data analysis with AI-powered automation, instant insights, and customizable dashboards. By combining intuitive search, automated alerts, and domain-specific Key Performance Indicators (KPIs), INSIA empowers companies to transform raw data into actionable intelligence for smarter, faster decision-making without technical expertise.
Key Features
- No-Code Analytics: Empowers non-technical users with drag-and-drop tools, enabling seamless data exploration, transformation, and analysis without complex coding knowledge.
- AI-Powered Insights: Automatically detects trends, anomalies, and opportunities using machine learning, ensuring businesses receive proactive recommendations instead of reactive reports.
- Instant Search-Based Queries: Google-like search interface lets users quickly find KPIs, metrics, or insights, delivering real-time answers from massive data sources instantly.
- Custom Dashboards & Reports: Flexible dashboards with domain-specific KPIs and templates help teams track performance, share insights, and align decisions with goals.
- Real-Time Data Quality Monitoring: Ensures accuracy by continuously validating data, flagging inconsistencies, and maintaining reliability across all reports and predictive analytics pipelines.
Benefits
- Empowers non-technical teams to explore data and generate actionable insights without coding expertise.
- Automatically identifies trends, anomalies, and opportunities, enabling proactive decision-making.
- Ensures data accuracy and reliability across dashboards and predictive models for instant action.
- Tailored KPIs and reports allow teams to align analytics with business goals efficiently.
2. Mixpanel
Mixpanel is a behavior analytics platform that helps SaaS and mobile teams turn user actions into insights. It enables deep funnel, retention, and cohort analysis, real-time tracking, and experiments without reliance on SQL, empowering product, growth, and engineering teams to make data-driven decisions fast.
Key Features
- Self-Service Behavioral Analytics: Track user interactions like clicks, flows, events, retention, funnels to reveal drop-off points and optimize onboarding or engagement.
- Real-Time & Event-Driven Insights: View up-to-date user behavior and activity streams, eliminating delays in understanding what users are doing now.
- Journey Mapping & Funnel Analysis: Visualize paths users take, from acquisition through conversion, identifying bottlenecks and optimizing flow for higher conversions.
- Retention & Cohort Tracking: Compare groups of users acquired around similar times or under similar conditions to understand which features or campaigns retain best.
Benefits
- Understands user interactions deeply, helping optimize product engagement and retention strategies.
- Provides immediate insights into user actions, enabling agile decision-making.
- Identifies bottlenecks in user flows, improving conversion rates and onboarding experiences.
- Helps evaluate feature adoption and campaign effectiveness across segmented user groups.
3. Kissmetrics
Kissmetrics is a behavior analytics platform that connects every action to a human, enabling SaaS and web businesses to track customer journeys, reduce churn, run funnels, and improve conversion through event tracking, cohort reports, and real-time insights. Widely trusted for its ability to tie analytics to revenue.
Key Features
- Human-Centric Event Tracking: Tracks every action to individual users, enabling personalized analysis of behavior and better attribution across multiple touchpoints.
- Multi-Channel Attribution: Measures which mix channels (email, social, search etc.) contribute to conversions, optimizing marketing spend.
- Funnel & Flow Analysis: Visualizes customer flows through product or website to find drop-off points and optimize steps to conversion.
- Cohort Reports & Retention Metrics: Groups users by acquisition date or behavior, allowing tracking of retention, feature adoption, and trial conversion over time.
Benefits
- Links every action to individual users, providing personalized insights for marketing and sales optimization.
- Evaluates effectiveness of different marketing channels for better resource allocation.
- Reveals drop-offs in customer journeys, aiding in conversion optimization.
- Monitors long-term engagement trends to reduce churn and boost customer lifetime value.
4. ChartMogul
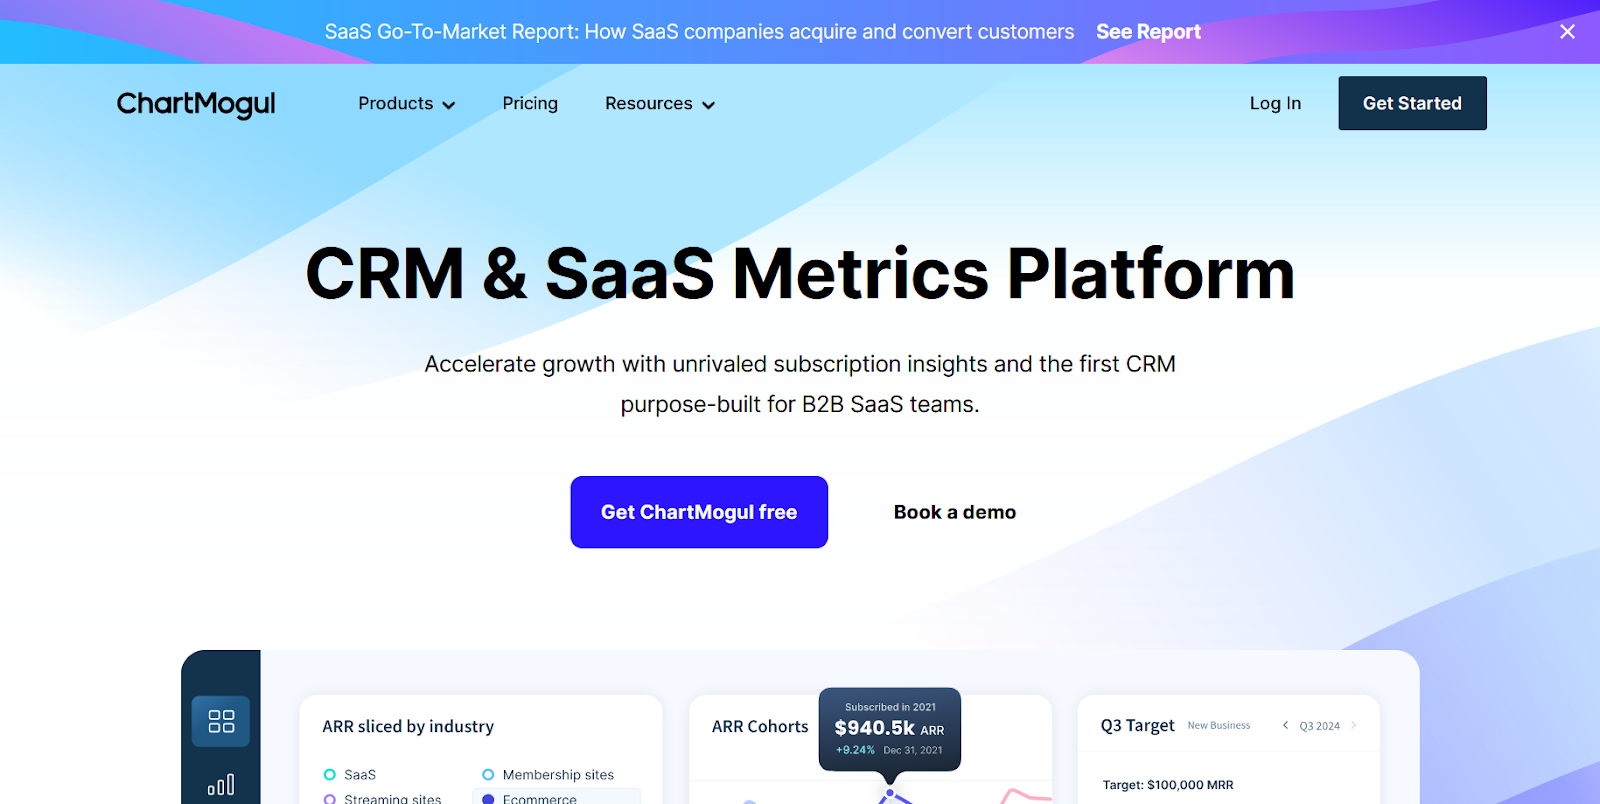
ChartMogul is a subscription analytics platform built for B2B SaaS teams. It centralizes revenue metrics like MRR, ARR, churn, and LTV, enabling benchmarking, performance tracking, and sales pipeline visibility. Designed for ease of use, it integrates with leading billing systems and CRMs to streamline subscription insights and drive growth.
Key Features
- Subscription Analytics: Provides detailed metrics such as MRR, ARR, churn, and revenue growth to understand financial performance of subscription models.
- CRM Integration & Pipeline Visibility: Combines subscription data with sales performance tracking to monitor leads, deals, and success metrics across the organization.
- Benchmarking & Target Setting: Enables B2B SaaS teams to compare performance versus peers and set realistic growth targets based on industry standards.
- Integrations with Billing & Data Tools: Works seamlessly with many billing platforms, CRMs, and data warehouses to unify data and simplify reporting.
Benefits
- Provides clear visibility into MRR, ARR, churn, and LTV for B2B SaaS teams.
- Combines revenue and sales data for a holistic view of business performance.
- Enables goal alignment and performance comparison against industry standards.
- Reduces manual consolidation of subscription and financial metrics.
5. Amplitude
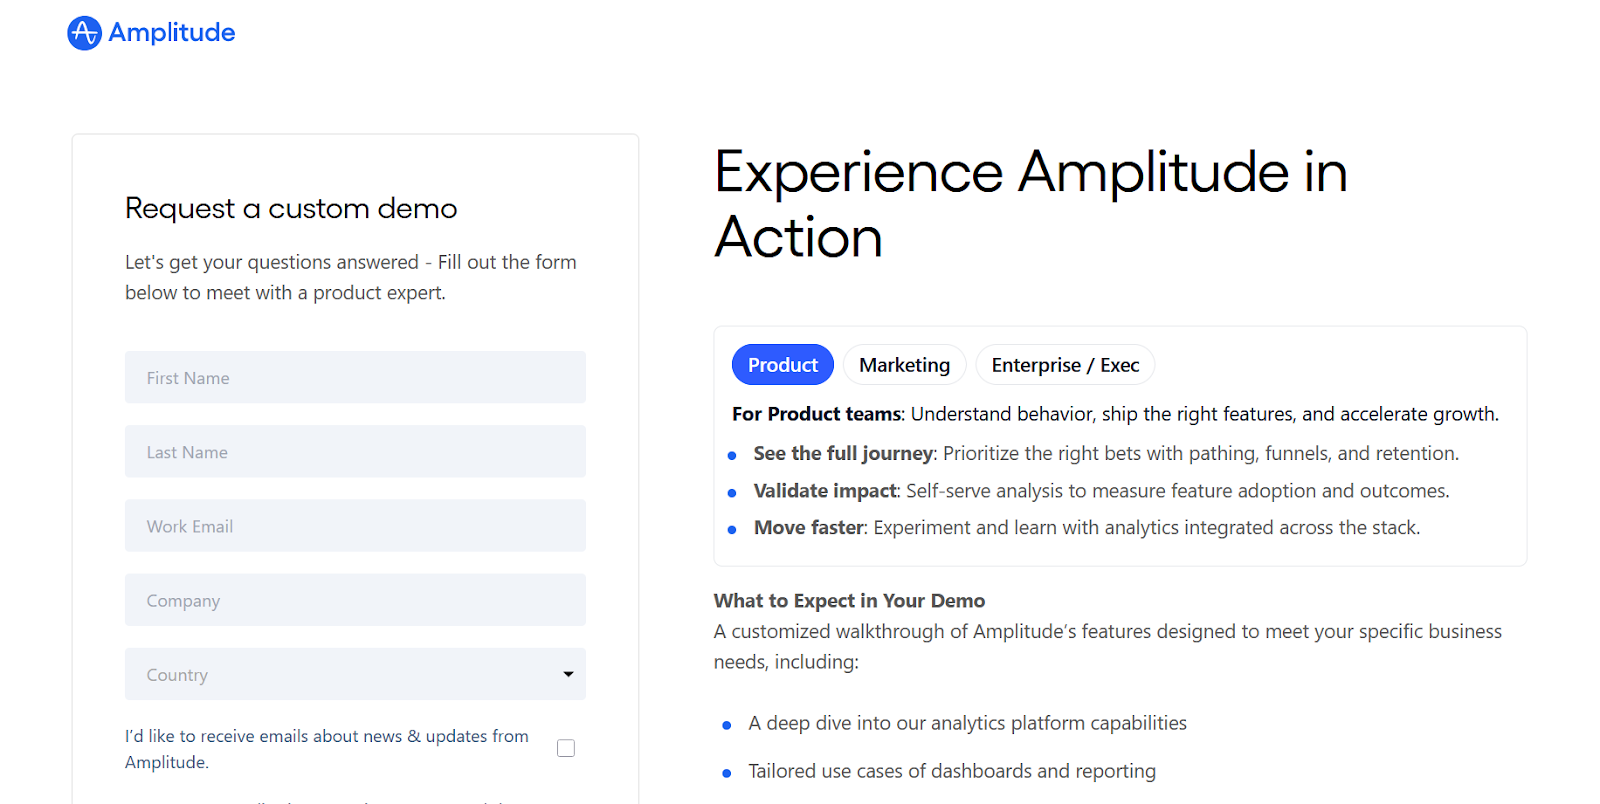
Amplitude is a product analytics platform helping teams understand user behavior, optimize product experiences, and iterate faster. It offers powerful features like session replay, A/B experiments, feature management, heatmaps, and real-time dashboards, enabling product, marketing, and engineering teams to make data-driven decisions with confidence.
Key Features
- Product Analytics & User Journeys: Track and analyze user flow, feature usage, and engagement metrics to deeply understand how users interact with your product.
- Feature Experimentation & Management: Run A/B or multivariate tests and gradually roll out features with flags, enabling validated product changes.
- Session Replay & Heatmaps: Visualize how users click, scroll, or navigate, identifying friction points and UX improvement opportunities.
- Web & Marketing Analytics: Analyze acquisition channels, campaign performance, and web traffic to optimize marketing investments and reduce bounce.
Benefits
- Tracks user behavior and feature adoption to optimize product experiences.
- Enables safe rollouts and A/B testing for validated product decisions.
- Visualizes user interactions to identify UX pain points.
- Supports campaign analysis and acquisition optimization alongside product insights.
6. Woopra
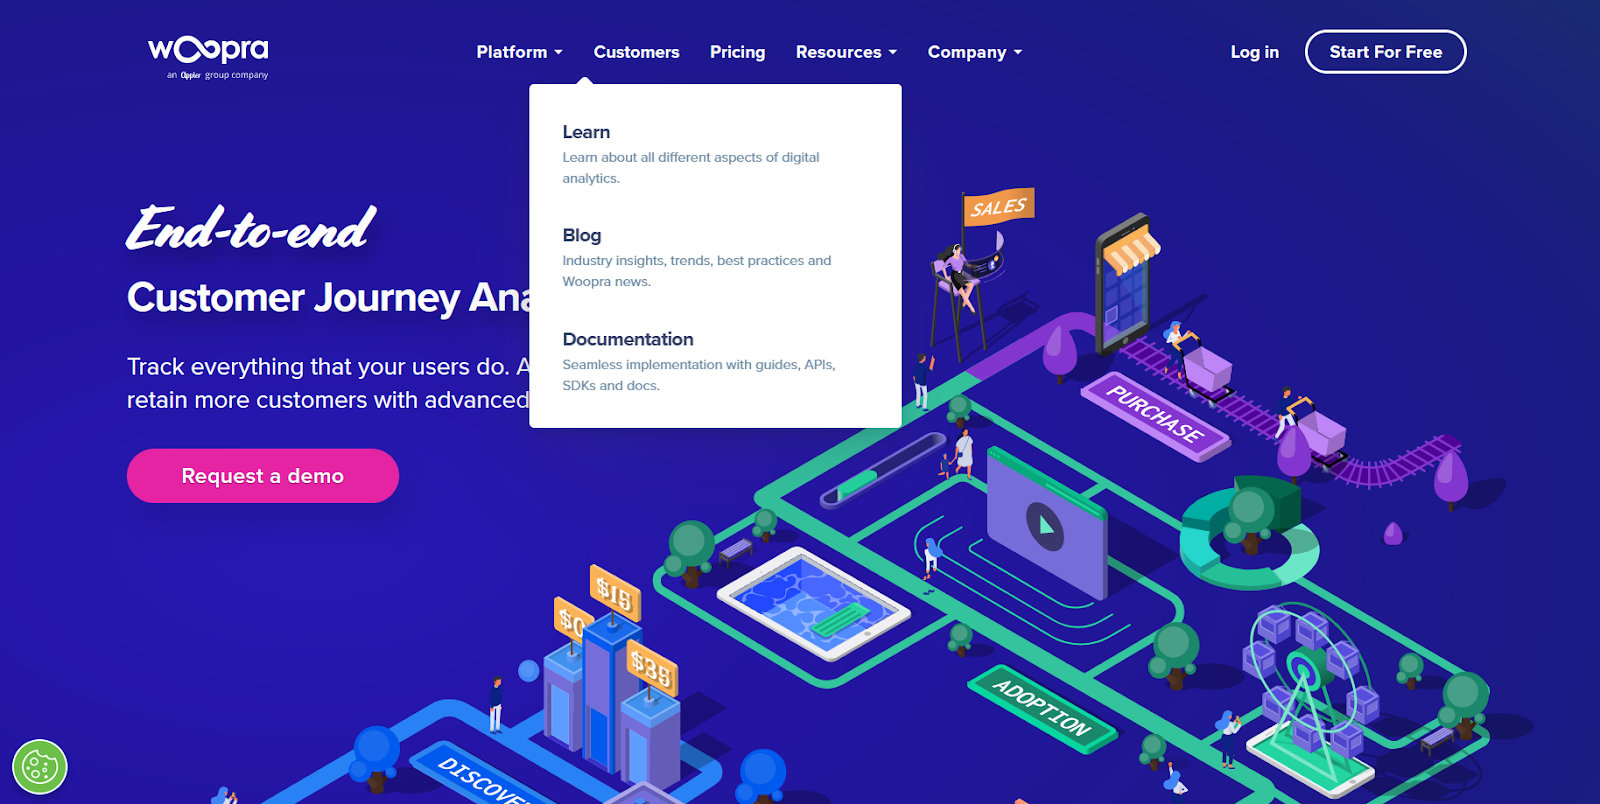
Woopra is a customer journey & product analytics platform that tracks every user action across touchpoints. It unifies data from product, marketing, sales, and support to reveal trends, retention, funnels, and real-time behavior. Built for actionable insights and automation, it emphasizes journey mapping and personalized engagement.
Key Features
- End-to-End Customer Journey Analytics: Visualizes how users move through acquisition, onboarding, and retention across product, marketing, and support touchpoints.
- People Profiles & Real-Time Action: Track individual user behavior, trigger automations like emails or updates based on real-time activity and attributes.
- 50+ Integrations & Data Sync: Seamlessly connect with databases, SaaS sources, marketing tools to unify historical and live data.
- Built-in Automations and Triggers: Automate workflows like alerts, campaign triggers, or internal notifications when specific user events happen.
Benefits
- Provides a unified view of user behavior across product, marketing, sales, and support.
- Triggers automations based on live user actions to boost engagement.
- Syncs with multiple data sources for comprehensive analytics coverage.
- Reduces manual monitoring with workflows, alerts, and campaign triggers.
7. Domo
Domo is a full-stack AI & data products platform offering centralized data integration, real-time Business Intelligence (BI) dashboards, no-code workflows, and automated insights. It helps enterprise teams unify data, monitor key metrics, build custom apps, and drive data-driven decisions while maintaining compliance, governance, and scalability.
Key Features
- Comprehensive Data Integration & ETL: Connects hundreds of data sources, auto-ingests, transforms via drag-and-drop Extract, Transform, Load (ETL) tools to unify datasets without manual coding.
- AI-Powered Analytics & Agents: Provides AI/agentic AI features including natural language queries and automated insights to identify anomalies and forecast outcomes.
- Real-Time BI Dashboards & Visualization: Offers highly visual dashboards, charts, and embedded analytics for all for instant performance tracking.
- No-Code & Low-Code Workflow Automation: Enables users to build workflows, alerts, and apps with minimal code, automating repetitive tasks and decision triggers.
Benefits
- Consolidates multiple datasets through ETL and unified dashboards.
- Identifies anomalies, forecasts outcomes, and delivers actionable recommendations.
- Offers instant visibility into key metrics for cross-functional teams.
- Automates repetitive tasks and decision triggers for operational efficiency.
Here’s a comparison chart of the top SaaS analytics tools based on features, focus areas, and target users:
| Tool | Primary Focus | Key Features | Ideal Users |
|---|---|---|---|
| INSIA | No-code analytics & AI insights | No-code analytics, AI-powered insights, search-based queries, custom dashboards, real-time data quality monitoring | Business teams, non-technical users |
| Mixpanel | Behavioral analytics | Self-service behavioral analytics, real-time event tracking, journey mapping, funnel & cohort analysis | Product, growth, engineering teams |
| Kissmetrics | Revenue-linked customer analytics | Human-centric event tracking, multi-channel attribution, funnel & flow analysis, cohort & retention metrics | SaaS, eCommerce, marketing teams |
| ChartMogul | Subscription & revenue analytics | Subscription metrics (MRR, ARR, churn, LTV), CRM integration, benchmarking, billing integrations | B2B SaaS, finance & sales teams |
| Amplitude | Product & user analytics | Product analytics, feature experimentation, session replay, heatmaps, marketing analytics | Product, marketing, engineering teams |
| Woopra | Customer journey & engagement | End-to-end journey analytics, people profiles, 50+ integrations, automation & triggers | Product, marketing, sales, support teams |
| Domo | Enterprise BI & AI analytics | Data integration & ETL, AI-powered analytics, real-time dashboards, no-code/low-code workflows | Enterprise teams, cross-functional analytics |
Implementing SaaS Analytics for Business Efficiency
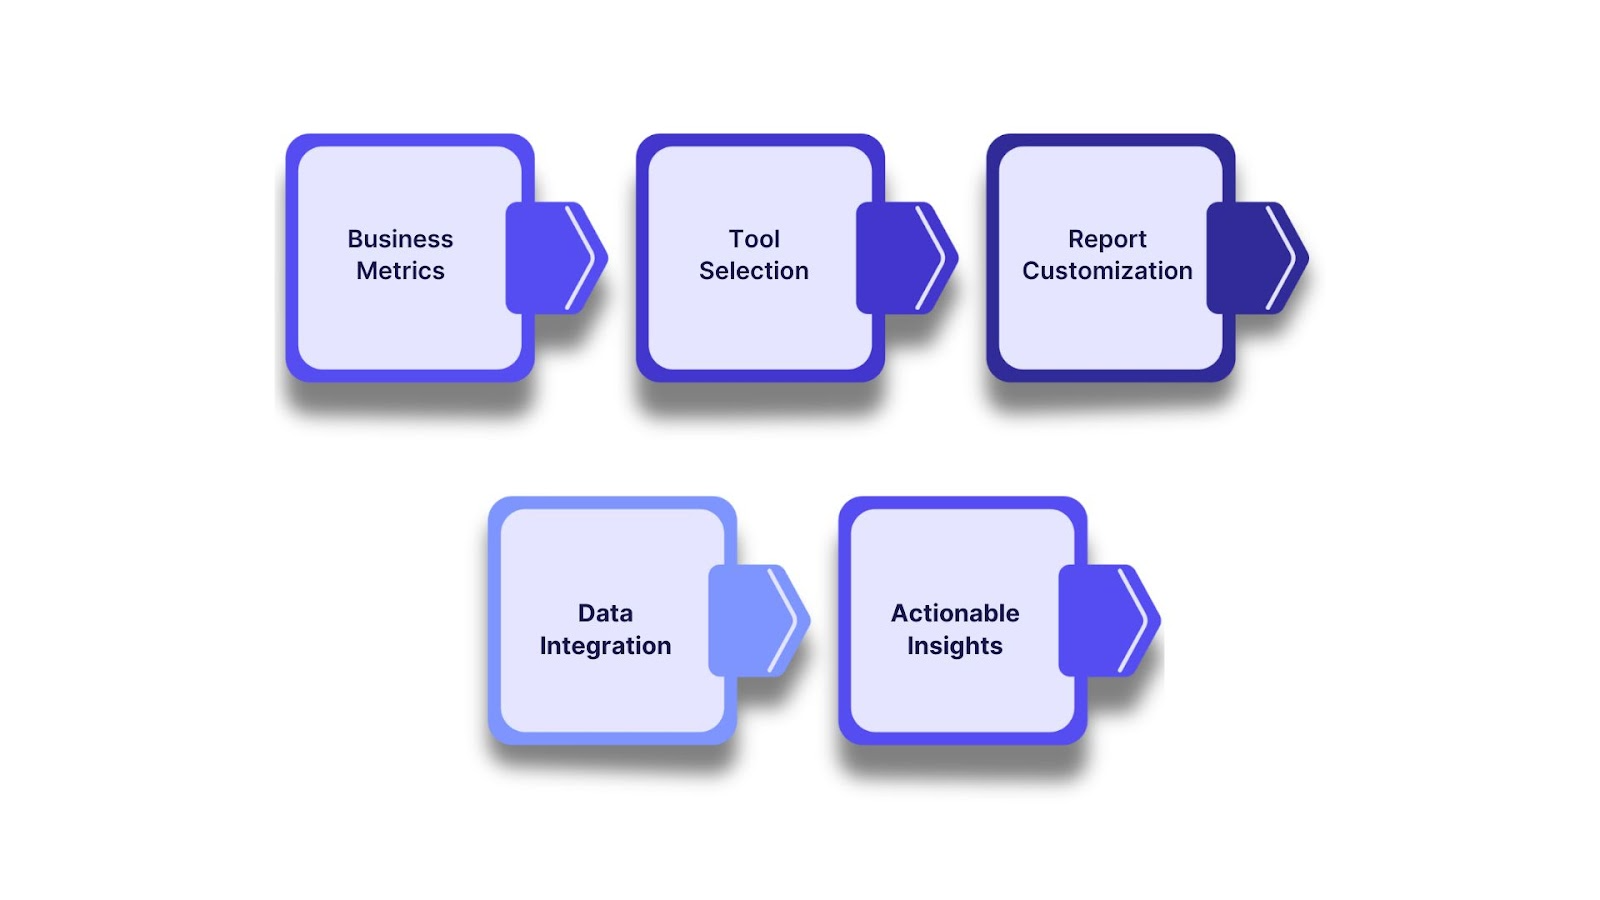
Integrating SaaS analytics tools into your business processes is essential for driving efficiency, improving decision-making, and unlocking growth opportunities.
- Identifying Business Goals and Metrics: Determine what your business aims to achieve with analytics. Identify the most relevant KPIs, such as MRR, churn, LTV, ARPU, or activation rate, to measure success accurately.
- Choosing the Right SaaS Analytics Tools: Evaluate tools based on business needs, budget, scalability, integration capabilities, and team skill levels. Prioritize platforms that offer real-time insights, customizable dashboards, and actionable recommendations to maximize Return On Investment (ROI).
- Setting Up and Customizing Reports: Configure dashboards to track the most critical metrics across departments. Customize reporting templates to provide relevant insights for marketing, sales, product, and customer success teams.
- Integrating Data Sources: Connect all relevant systems, including CRM, billing, marketing automation, product usage, and customer support platforms. Ensure data quality by cleansing, standardizing, and validating inputs from multiple sources to maintain reliability.
- Leveraging Insights for Action: Use analytics to identify trends, monitor user behavior, and predict outcomes for proactive decision-making. Implement data-driven strategies for customer retention, upselling, operational efficiency, and revenue growth.
Also Read: What Is SaaS Data Security? Best Practices & Challenges
Use Cases of SaaS Analytics in Real-world Scenarios
From optimizing operational efficiency to enhancing customer experiences, SaaS analytics platforms empower organizations to make data-driven decisions that drive growth and competitiveness.
Case Study: How INSIA Revolutionized Trident's Diesel Engine Services
Company Overview
Trident Services is a leading dealer and service provider for Cummins diesel gensets and power rail engines, operating across multiple sectors.
Business Challenges
- Labor-intensive data entry and compilation consuming significant time and resources.
- Slow report generation, delaying access to critical performance metrics.
- Difficulty tracking and managing inventory across multiple locations.
Implementation of INSIA
- INSIA’s drag-and-drop console enabled easy upload of complex datasets from multiple sources.
- Data functions were implemented one at a time, ensuring accuracy and smooth adoption.
- Customized calculations were incorporated to meet OEM-specific requirements.
Results Achieved
- Over 45 hours per month saved on manual reporting.
- Leadership meetings reduced from 4 hours to just 1 hour weekly/monthly.
- Guided search allowed staff of all technical levels to interpret and use data effectively.
- Custom dashboards streamlined operations and engagement.
- Advanced analytics provided deeper insights into service performance and customer behavior.
Read the full case study here.
Case Study: How INSIA Revolutionized Alaric’s Pharmaceutical Supply Chain
Company Overview
Alaric Enterprises operates at the heart of the pharmaceutical supply chain, specializing in procuring and distributing a wide range of drugs from pharmaceutical companies to hospitals.
Business Challenges
- Constant monitoring of high-volume Stock Keeping Units (SKUs) to prevent stockouts of very fast-moving drugs.
- Managing slow-moving drugs to avoid overstocking and expiry risks.
- Complying with strict pharmaceutical regulations and maintaining accurate records.
- Predicting fluctuating demand across thousands of SKUs, critical for operational efficiency and patient safety.
Implementation of INSIA
- Connected Sage ERP via APIs for real-time inventory, sales, and order data.
- Automated categorization into Very Fast Moving, Fast Moving, Slow Moving, and Very Slow Moving, enabling focused management of over 50,000 SKUs.
- Captured historical inventory KPIs to track trends and inform strategy.
- Introduced metrics like Net Stock, Safety Days, Inventory Stock Days, Excess Stock Value, Ideal Stock Value, and Reorder Quantity.
Results Achieved
- Streamlined data processing and inventory monitoring.
- Faster, more accurate demand predictions for both fast and slow-moving drugs.
- Prevented stockouts of critical drugs and minimized waste from expired stock.
- Custom dashboards and predictive analytics facilitated better decision-making and resource allocation.
- Ensured uninterrupted supply of vital medications to hospitals, reinforcing Alaric’s reliability and patient care outcomes.
Read the full case study here.
Challenges in Using SaaS Analytics
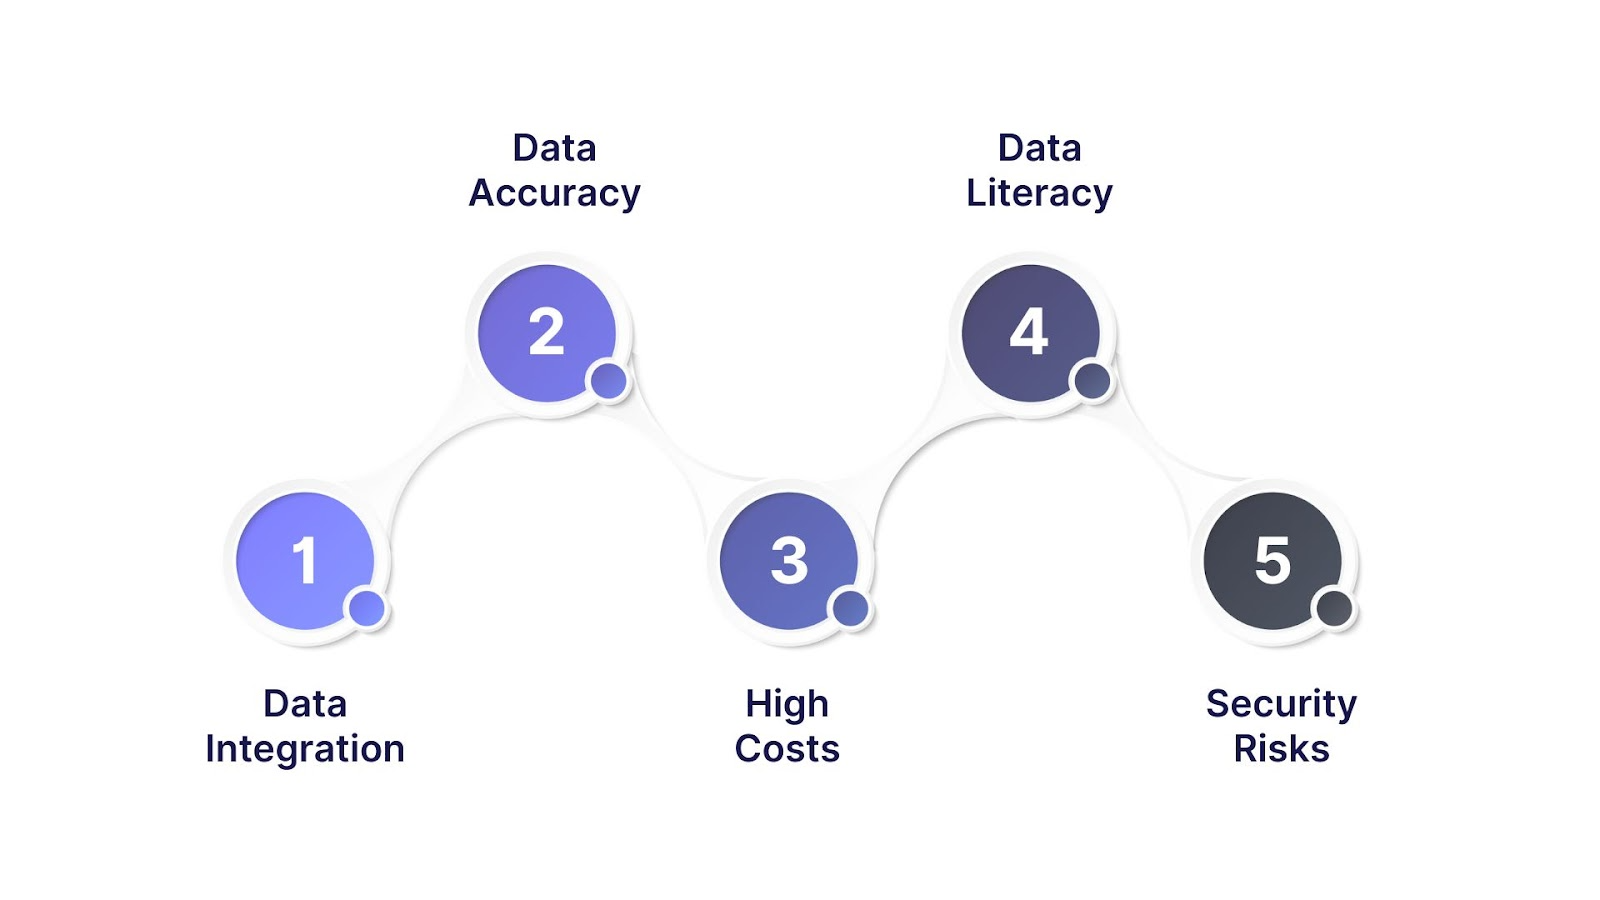
While SaaS analytics offers immense potential, businesses often encounter hurdles that can limit its effectiveness if not addressed.
- Data Integration Complexity: SaaS companies often use multiple tools (CRM, billing, marketing, support) that generate siloed data. Without proper integration, metrics like Customer LTV or NRR may be inaccurate.
- Ensuring Data Accuracy and Consistency: Inconsistent data entry, duplicate records, or delayed updates can skew analytics. Leads to unreliable insights, poor decision-making, and misaligned strategies.
- High Implementation and Maintenance Costs: Advanced SaaS analytics platforms may require significant investment and ongoing technical support. Small or scaling businesses may struggle to balance cost with expected ROI.
- Lack of Data Literacy Across Teams: Not all employees are trained to interpret dashboards or apply analytics insights effectively. Valuable data remains underutilized, reducing the organization’s overall efficiency.
- Privacy, Compliance, and Security Risks: SaaS businesses handling sensitive customer and financial data must comply with regulations like GDPR or CCPA. Inadequate compliance or weak security frameworks can lead to penalties and loss of customer trust.
Future Trends in SaaS Analytics
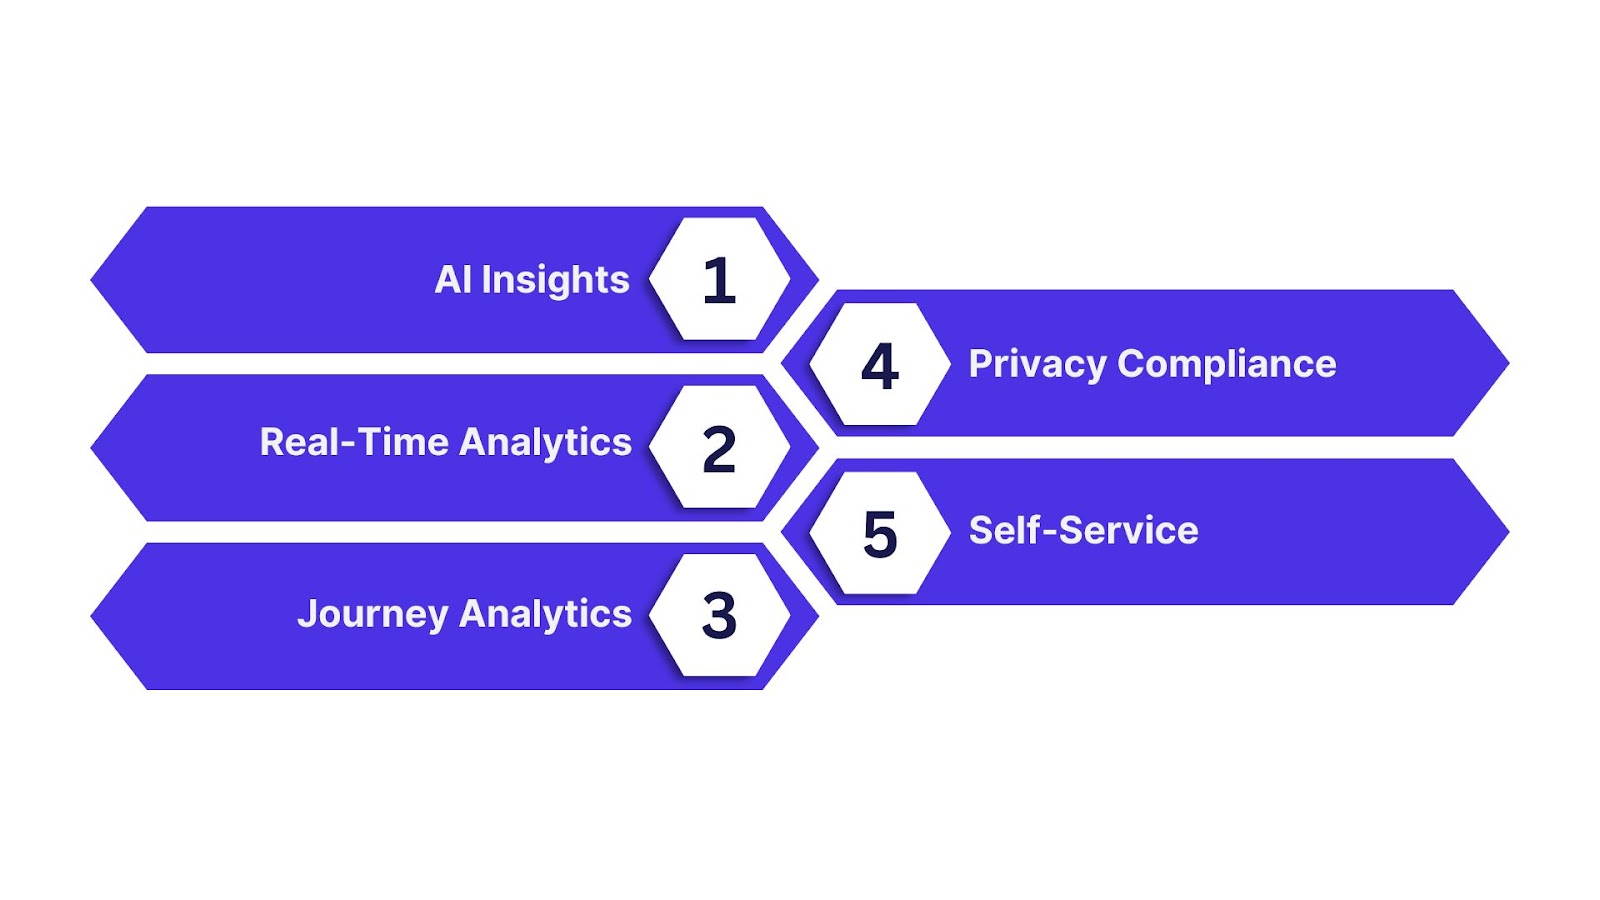
SaaS analytics continues to evolve rapidly, with innovations shaping how businesses extract value from data. The future will see deeper integration of advanced technologies to drive faster, smarter, and more predictive decision-making.
- AI and Machine Learning–Driven Insights: SaaS analytics platforms will increasingly embed AI and ML to provide predictive modeling, anomaly detection, and automated recommendations. Businesses will shift from descriptive dashboards to prescriptive insights that suggest actionable strategies.
- Real-Time and Streaming Analytics: Companies will rely on real-time analytics to monitor customer behavior, product usage, and revenue in the moment.
- Advanced Customer Journey Analytics: SaaS analytics will focus more on end-to-end customer lifecycle tracking, combining marketing, sales, product usage, and support data.
- Greater Emphasis on Data Privacy and Compliance Analytics: With stricter regulations, SaaS platforms will integrate privacy-by-design analytics tools.
- Self-Service and No-Code Analytics: As businesses aim to democratize data, self-service dashboards and no-code analytics platforms will rise. Non-technical users will access deeper insights without depending on data scientists or engineers.
Conclusion
SaaS analytics tools have become indispensable in driving data-driven growth and efficiency. By tracking critical metrics such as MRR, churn, and customer lifetime value, these platforms transform raw data into actionable insights that help businesses stay competitive.
To stay ahead, it’s essential to use tools that align with your business model, industry, and growth stage. Whether through real-time dashboards, AI-powered forecasts, or embedded analytics, the right platform can be the difference between reactive management and proactive, scalable success.
Ready to harness the power of SaaS analytics for your business? Discover how INSIA can help you unlock growth with data-driven intelligence.